
It has been about a month since the last earnings report for The Clorox Company (NYSE:CLX) . Shares have added about 8.7% in that time frame.
Will the recent positive trend continue leading up to its next earnings release, or is CLX due for a pullback? Before we dive into how investors and analysts have reacted as of late, let's take a quick look at the most recent earnings report in order to get a better handle on the important drivers.
Clorox Q3 Earnings Beats Estimates, Trims '18 EPS View
Clorox posted impressive third-quarter fiscal 2018 results, surpassing the Zacks Consensus Estimate on both counts. Earnings and revenues also improved on a year-over-year basis. This marks the company’s sixth straight quarter of earnings beat, with sales returning to positive after a miss in the previous quarter.
Q3 Highlights
Quarterly earnings from continuing operations of $1.37 per share were up 5% year over year and surpassed the Zacks Consensus Estimate of $1.30. The bottom line primarily gained from higher sales and lower effective tax rate, offset by contraction in gross margin.
Net sales of $1,517 million advanced nearly 2.7% year over year and marginally came ahead of the Zacks Consensus Estimate of $1,511 million. Top-line growth can be attributed to improvement across all the company’s segments as well as 2020 Strategy, which focuses on boosting growth for the improvement of categories and overall market share. Also, volume growth of 3% in the quarter along with higher prices aided the increase in revenues. The uptick was somewhat compensated with adverse mix and negative impact from the sale of the Aplicare business.
Clorox witnessed significant pressure on gross margin, which contracted 120 basis points (bps) to 42.8% in the quarter. Lower margins can be attributed to elevated commodity and logistics expenses, which were partly mitigated with gains from cost savings and higher prices.
Revenue by Segment
Sales in the Cleaning segment improved 3% to $513 million, mainly driven by gains in Home Care, showing strength in Clorox disinfecting wipes along with the launch of Scentiva branded products. This was partly offset by fall in Professional Products business, particularly due to the sale of Aplicare business in August 2017.
Household sales inched up 1% to $493 million backed by double-digit gains in the Cat Litter business owing to broad-based business strength. This was partly offset with lower shipments in Charcoal owing to unfavorable weather throughout the quarter.
Sales at the Lifestyle segment improved 2% to $252 million driven by all-time record shipments of Hidden Valley bottled dressings and gains in the Natural Personal Care business. The upside was negated by lower shipments in Water Filtration due to a timing shift in the merchandising activity.
At the International business segment, sales grew 4% to $259 million backed by improved pricing and increased volumes in Canada. However, these factors were offset by adverse mix and foreign currency exchange rates.
Financials
Clorox ended the quarter with cash and cash equivalents of $1,174 million, and long-term debt of $1,789 million. In the nine months of fiscal 2018, the company generated $574 million of net cash from continuing operations.
2018 Guidance
Clorox updated its guidance for fiscal 2018 to include the effects from the acquisition of Nutranext and revised tax rate.
The company now projects sales growth of nearly 3% compared with the earlier guided range of 1-3%. The guidance includes contribution of 1 point from the Nutranext acquisition and an estimated 3 points gain from product innovation. Also, it includes nearly 1 point reduction in the fiscal year related to the Aplicare divestiture.
Gross margin is now estimated to decline in the range of 100-150 bps due to estimated impacts from one-time charges with respect to the Nutranext acquisition. Also, it reflects higher logistics and commodity expenses.
For fiscal 2018, the company envisions effective tax rate of 22-23% compared with 23-24% guided earlier.
Consequently, management now anticipates fiscal 2018 earnings from continuing operations to be in the range of $6.15-$6.30 per share, down from the previous guidance of $6.17-$6.37 per share.
How Have Estimates Been Moving Since Then?
In the past month, investors have witnessed a downward trend in fresh estimates. There have been five revisions lower for the current quarter.
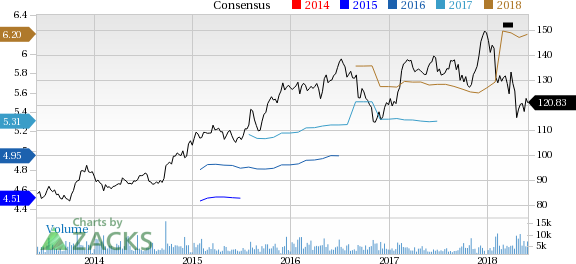
The Clorox Company Price and Consensus
VGM Scores
At this time, CLX has an average Growth Score of C, a grade with the same score on the momentum front. Following the exact same course, the stock was also allocated a grade of C on the value side, putting it in the middle 20% for this investment strategy.
Overall, the stock has an aggregate VGM Score of C. If you aren't focused on one strategy, this score is the one you should be interested in.
Based on our scores, the stock is equally suitable for value, growth and momentum investors.
Outlook
Estimates have been broadly trending downward for the stock and the magnitude of these revisions indicates a downward shift. Notably, CLX has a Zacks Rank #3 (Hold). We expect an in-line return from the stock in the next few months.
The Clorox Company (CLX): Free Stock Analysis Report
Original post
Zacks Investment Research