
It has been about a month since the last earnings report for Broadridge Financial Solutions, Inc. (NYSE:BR) . Shares have added about 5% in that time frame.
Will the recent positive trend continue leading up to its next earnings release, or is BR due for a pullback? Before we dive into how investors and analysts have reacted as of late, let's take a quick look at its most recent earnings report in order to get a better handle on the important catalysts.
Broadridge Q3 Earnings & Revenues Top, EPS View Up
Broadridge Financial Solutions reported strong third-quarter fiscal 2018 results with earnings and revenues surpassing the Zacks Consensus Estimate.
Adjusted earnings of $1.00 per share beat the consensus mark by 21 cents and increased 45% year over year. The bottom line benefited from lower tax rates (as a result of the Tax Cuts and Jobs Act) and improvement in adjusted operating income.
As a result of the Tax Act, the effective tax rate for the reported quarter reduced to 12.9% from 28.6% in the prior-year period. The company also witnessed $15.6 million of tax benefit from stock-based compensation. This was, however, partially offset by $16.1 million of net tax charges associated with the Tax Act.
Total revenues of $1.07 billion beat the Zacks Consensus Estimate of $1.03 billion. The figure was up 6.2% year over year. The top line benefited from robust event-driven fee revenues, higher recurring fee revenues and distribution revenues.
Recurring fee revenues increased 8% to $639 million due to higher organic growth, which was backed by net new business, internal growth and acquisition-related synergies. Event-driven fee revenues increased 9% to $67 million due to higher proxy contests. Distribution revenues increased 2% to $385 million. There was also a positive impact of $1 million from foreign currency movements.
Revenues by Segment
Investor Communication Solutions segment (79.79% of total revenues) revenues increased 4.2% from the year-ago quarter to $855.3 million. Segment revenues were driven by higher recurring fee revenues ($403 million) from internal growth, net new business and acquisitions, elevated event-driven fee revenues ($67 million) and distribution revenues ($385 million).
Global Technology and Operations segment (21.94%) revenues came in at $235.2 million, up 12.8% from the year-ago quarter. Segment revenues were driven by internal growth from higher trade and non-trade activity levels, higher net new business from closed sales and buyouts.
Operating Results
Operating income increased 19% year over year to $130 million. Adjusted operating income came in at $152 million, up 13% from the year-ago quarter.
Operating income margin rose to 12.1% from 10.9% in the year-ago quarter. Adjusted operating income margin rose to 14.1% from 13.2% in the year-ago quarter. The margin expansion was driven by higher recurring fee revenues.
Selling, general and administrative expenses increased 10.6% to $138.8 million. Total operating expenses increased 4.7% to $941.9 million.
Balance Sheet and Cash Flow
Broadridge exited third-quarter fiscal 2018 with cash and cash equivalents of $352.1 million compared with $366.5 million at the end of December 2017. As of Mar 31, 2018, long-term debt was $1,203.1 million compared with $1,222.7 million at the end of December 2017.
The company generated $274.8 million of cash from operating activities in the reported quarter compared with $162.1 million in the year-ago quarter. Free cash flow was $204.2 million compared with $92.6 million in the year-ago quarter.
During the reported quarter, the company returned $123 million to its shareholders in the form of dividends compared with $80.4 million in second-quarter fiscal 2018.
Fiscal 2018 Guidance
Broadridge raised its fiscal 2018 guidance for adjusted EPS growth to 31-35% from 27-31%, while reaffirming its outlook for revenue growth and margin expansion.
Total revenues are expected to grow in the rate of 2-4%. Recurring revenue growth is expected in the range of 4-6%. Adjusted operating income margin is still estimated to be approximately 16%. It also reiterated free cash flow expectations in the range of $500-$550 million.
How Have Estimates Been Moving Since Then?
In the past month, investors have witnessed a downward trend in fresh estimates. There have been two revisions lower for the current quarter.
Broadridge Financial Solutions, Inc. Price and Consensus
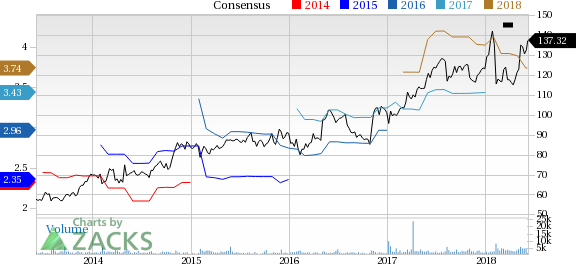
Broadridge Financial Solutions, Inc. Price and Consensus | Broadridge Financial Solutions, Inc. Quote
VGM Scores
At this time, BR has a great Growth Score of A, though it is lagging a bit on the momentum front with a B. However, the stock was allocated a grade of D on the value side, putting it in the bottom 40% for this investment strategy.
Overall, the stock has an aggregate VGM Score of B. If you aren't focused on one strategy, this score is the one you should be interested in.
Our style scores indicate that the stock is more suitable for growth investors than momentum investors.
Outlook
Estimates have been broadly trending downward for the stock and the magnitude of these revisions indicates a downward shift. Interestingly, BR has a Zacks Rank #2 (Buy). We expect an above average return from the stock in the next few months.
Broadridge Financial Solutions, Inc. (BR): Free Stock Analysis Report
Original post