
It is now April 2, and the time of the year for a transition from withdrawals to injections into storage in the natural gas market. In 2019, the final withdrawal was during the week ending on March 22. In 2018, the withdrawal season ended late, with the last coming during the week ending on April 20. In 2017, they finished on March 24, and in 2016 around March 25.
On Thursday, April 2, the Energy Information Administration released its inventory report for the week that ended on March 27. Meanwhile, the price of the energy commodity slipped back below the $1.60 per MMBtu level before the stockpile report.
The United States Natural Gas Fund, LP (NYSE:UNG) is the ETF product that moves higher and lower with the price of the energy commodity.
The market expected another small withdrawal of 6 bcf
According to the Estimize website, the consensus for the March 27 data from the EIA was for a minor 6 billion cubic feet decline in stockpiles.
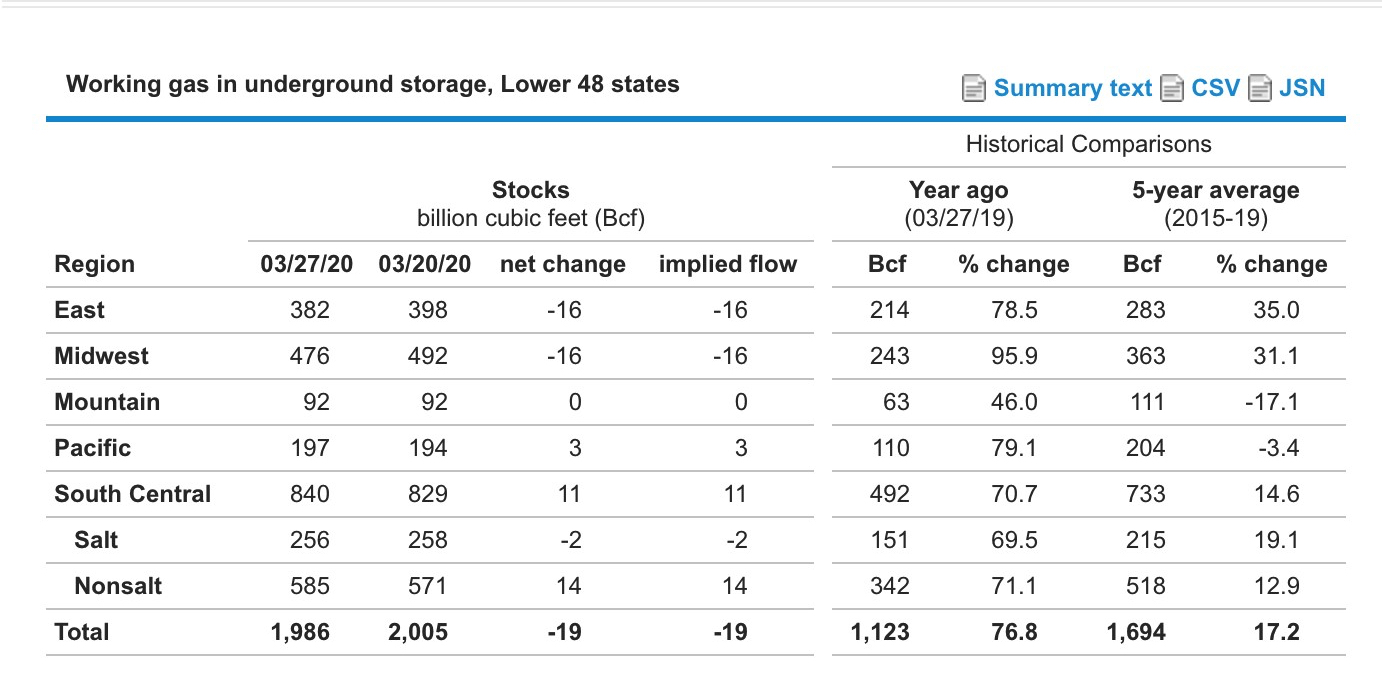
(Source: CQG)
As the chart highlights, the EIA reported that inventories declined by 19 billion cubic feet in the latest report pushing the total stocks below the 2-trillion-cubic-feet level to 1.986 tcf in the final report for March. Even though the withdrawal season did not end, stockpiles were 76.8% above last year’s level and 17.2% above the five-year average for the end of this year.
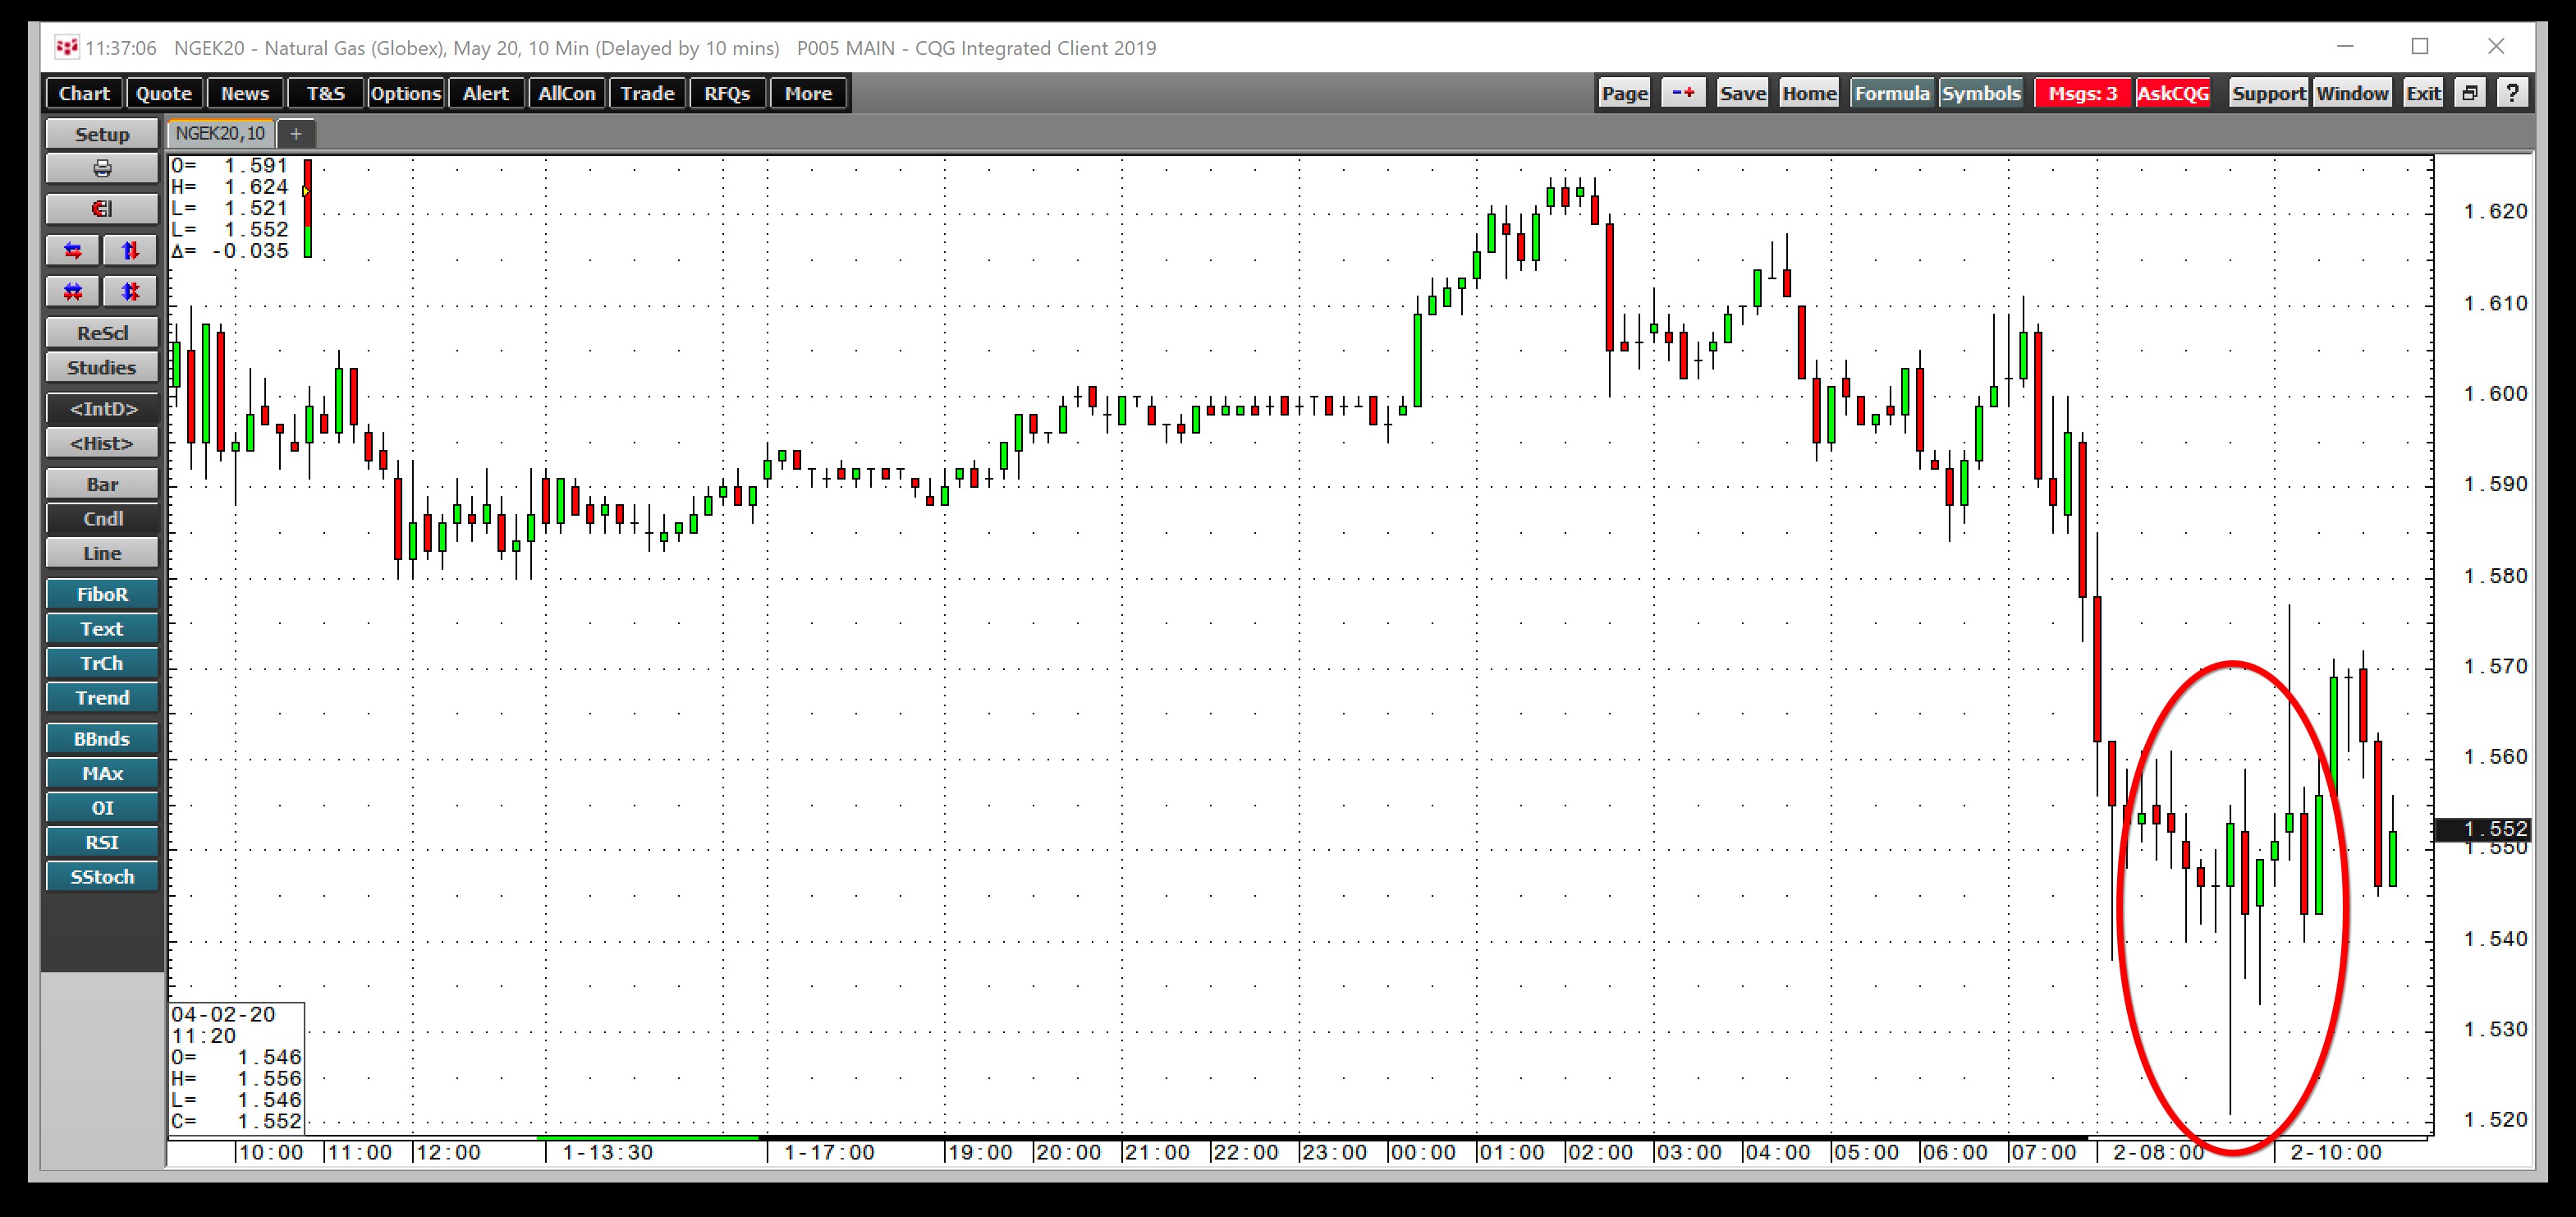
(Source: CQG)
The 10-minute chart shows that the market’s reaction to the latest inventory data pushed the price of nearby May natural gas futures to a low of $1.521 before recovering. The energy commodity came within two ticks of the most recent low.
Natural Gas Moves Back Towards The Low
The highest levels of inventories in years and the overall price carnage in the energy sector has the price of natural gas sitting not far above the recent low on the continuous contract. On the active month May futures contract, natural gas fell to a lower low.
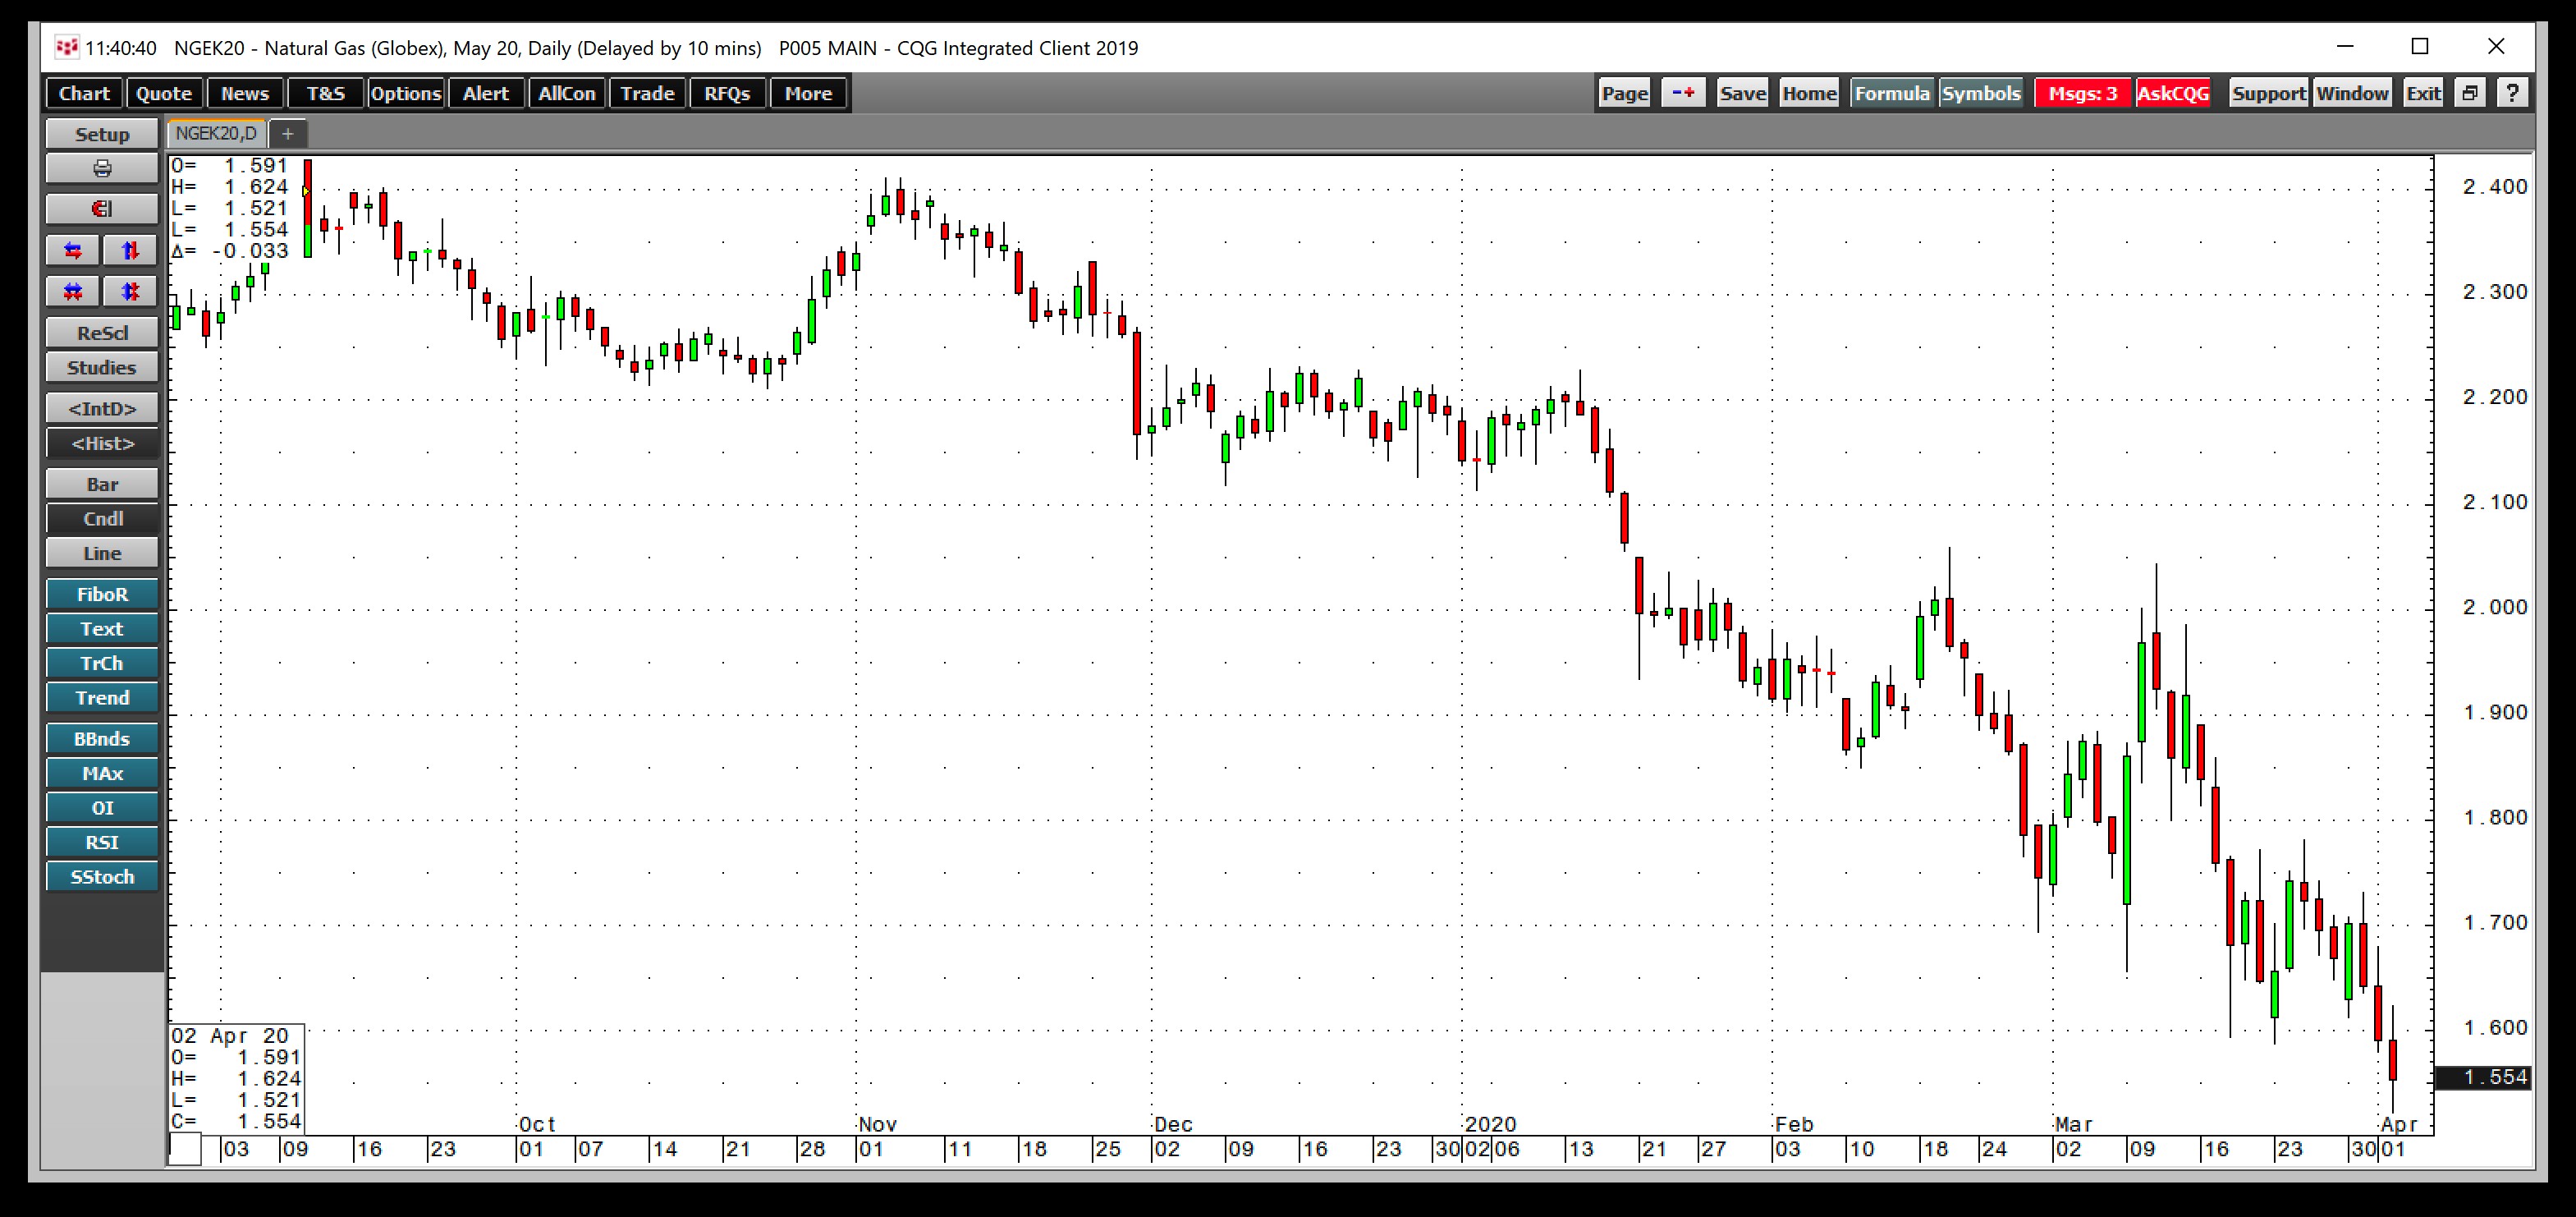
(Source: CQG)
The daily chart of May futures shows that at $1.521 on April 2, the energy commodity put in a new and lower low.
(Source: CQG)
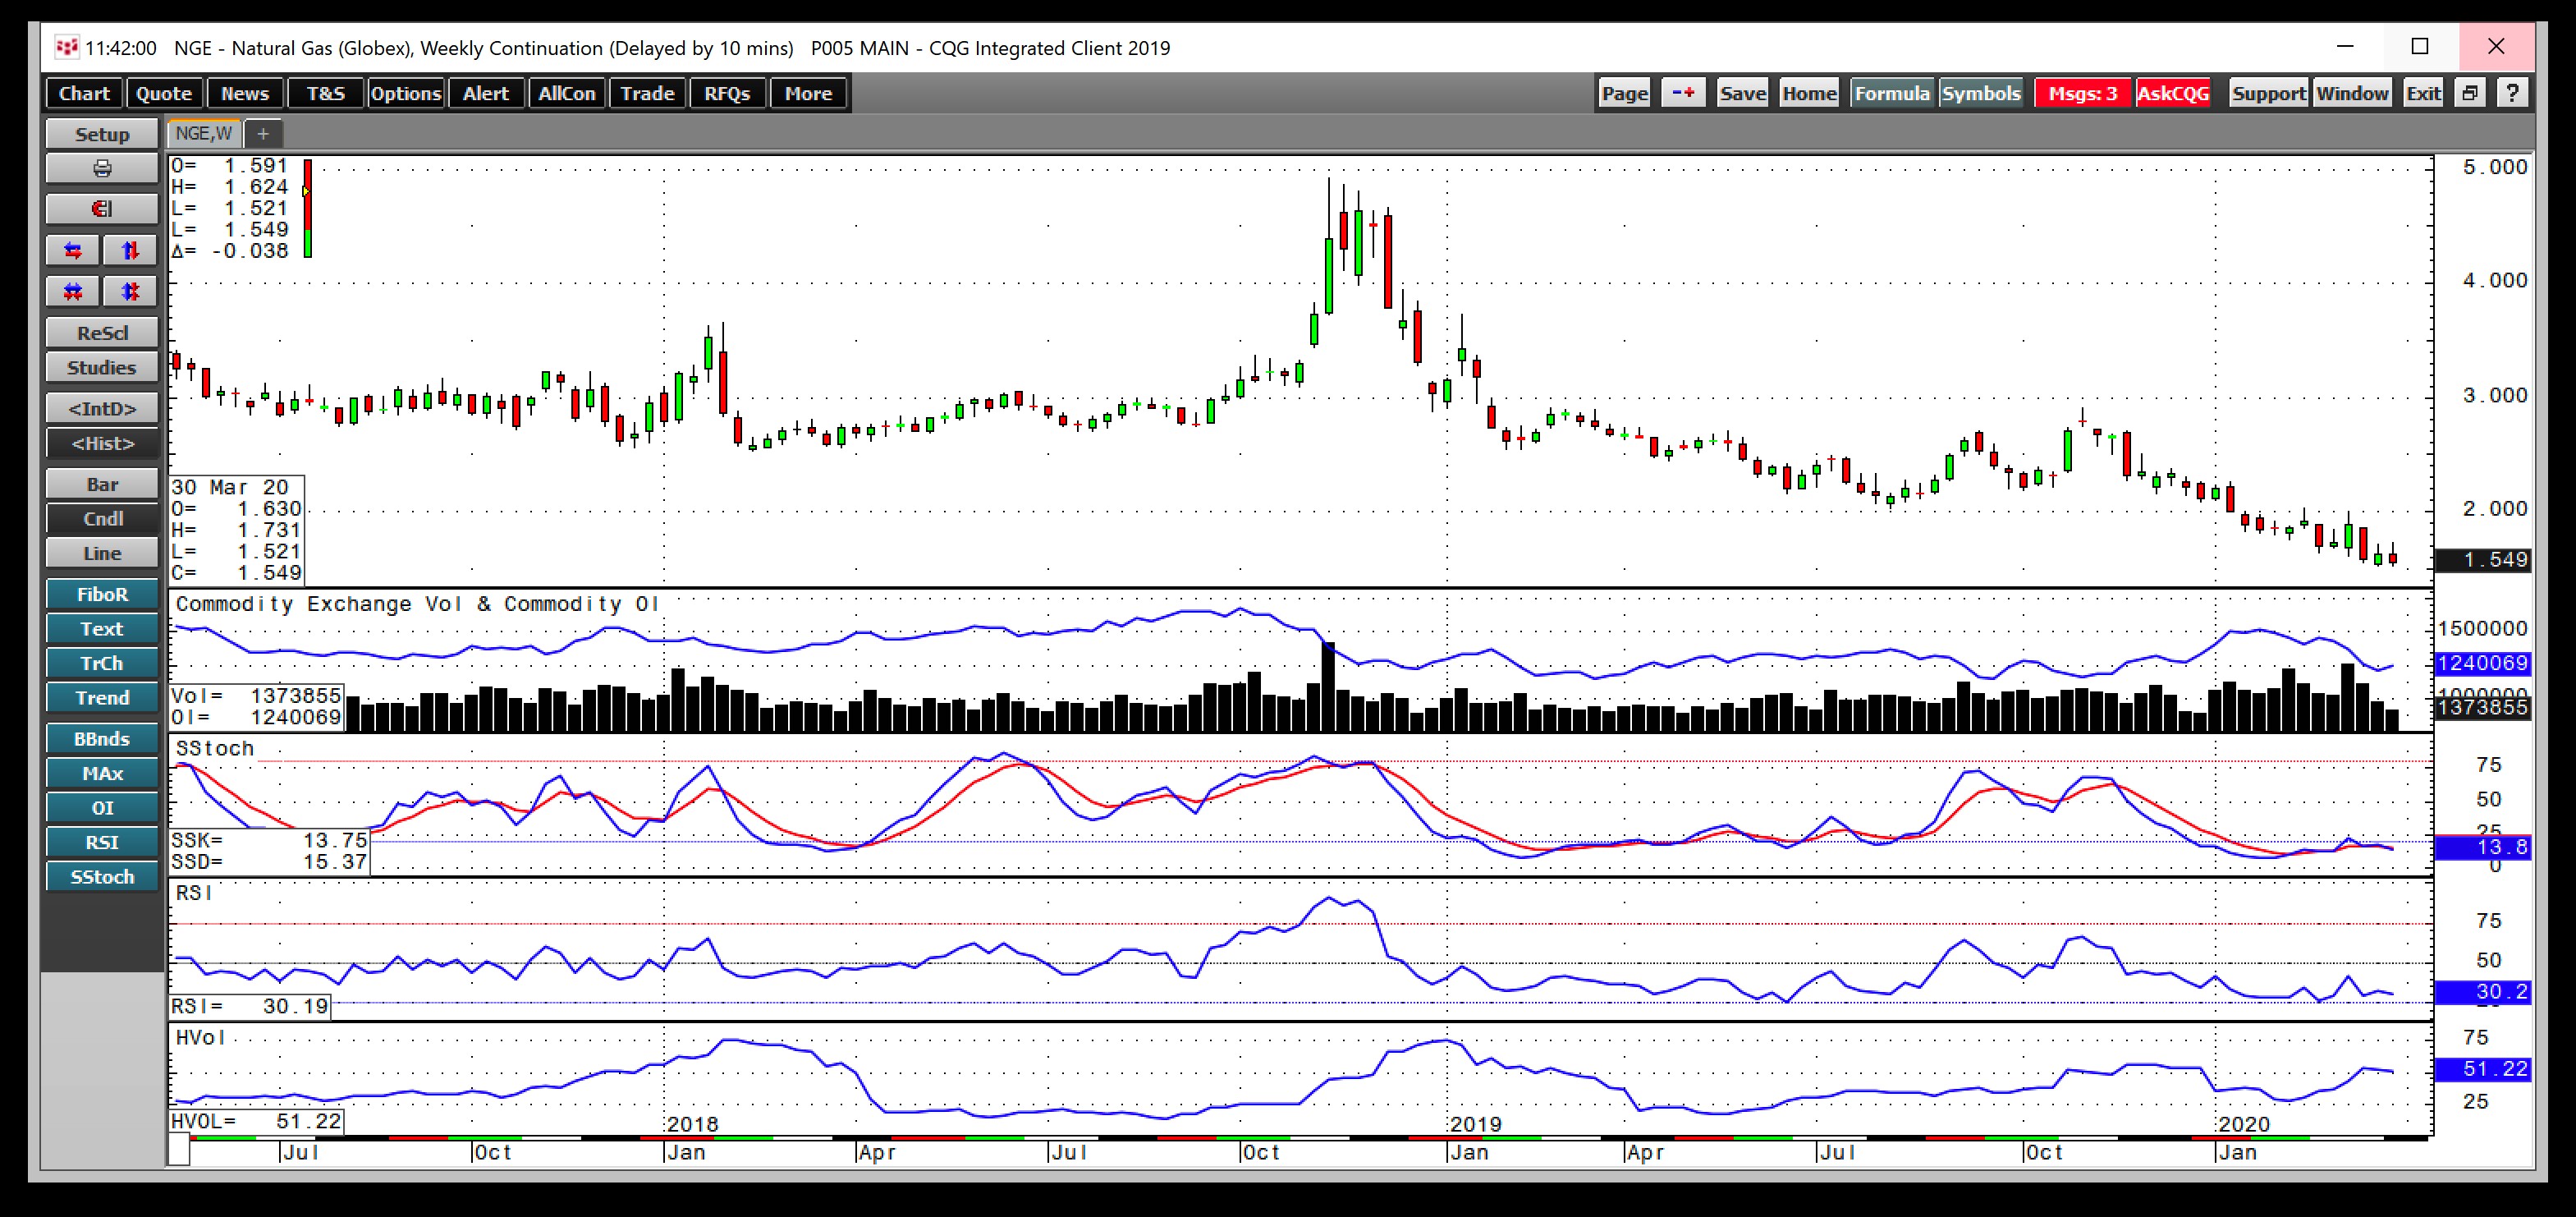
The weekly chart shows that the continuous contract avoided a new low by only $0.002 on April 2. Price momentum and relative strength indicators were in oversold territory with the May futures at the $1.55 per MMBtu level. Open interest declined from 1.451 million contracts in late February to 1.24 million as of April 1. The decline in open interest is both seasonal and reflects that many market participants have moved to the sidelines, given volatile trading conditions these days. Weekly historical volatility at 51.22% is close to the highest level of 2020. Each rally since in the natural gas market since November 2019 has attracted selling, and that trend continues.
The Deflationary Spiral Continues, But It Is A Bumpy Road
Natural gas was moving lower long before the deflationary spiral caused by the spread of coronavirus began. With businesses around the world closed down, people remaining at home, and the weather in the northern hemisphere entering spring, demand for natural gas is falling.
When it comes to supplies, many oil and gas companies are on the verge of bankruptcy. A decline in production over the coming months is on the horizon. The trend in almost all asset classes remains lower, and fear and uncertainty are at peaks. Over the past two weeks, 10 million people in the U.S. filed for first-time unemployment benefits. As the number of cases and fatalities rises, we will continue to see pressure on all markets, and natural gas may not be an exception. However, periods of hope will emerge, and there is a light at the end of the current dark tunnel. Expect lots of volatility in the natural gas market. We could see the price probe below the $1.50 level to a new low, but each new low has given way to a recovery rally that has ultimately failed. The rally that holds will need to come from a decrease in output over the coming weeks and months.
A continuation of the withdrawal season into April is not bearish for the price of natural gas. The high level of inventories and demand destruction is not at all bullish.