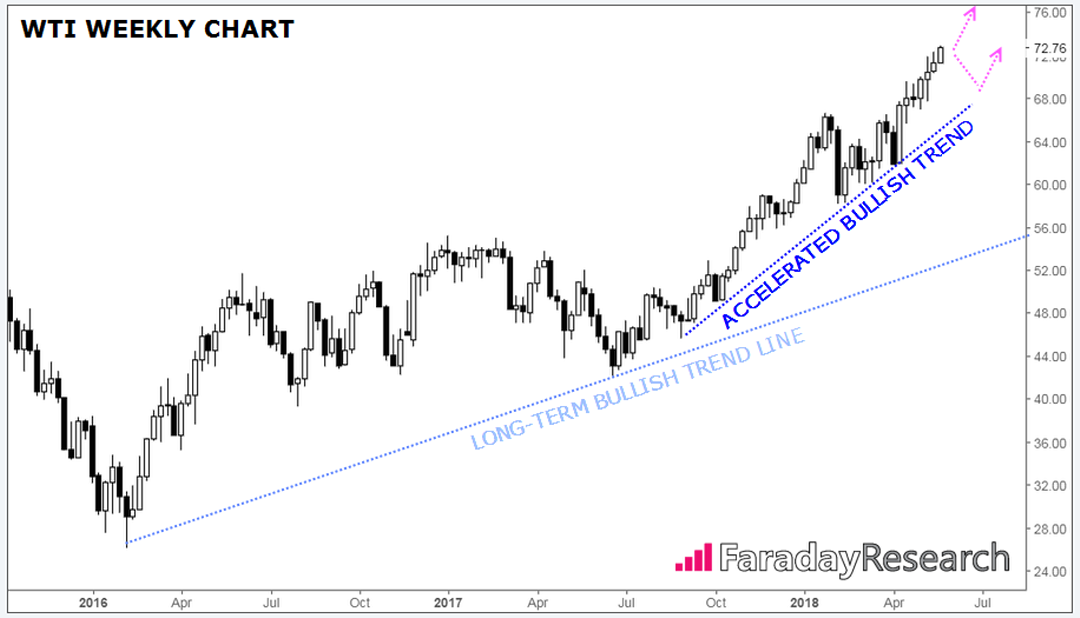
From $145 to $35 to $115 to nearly $25 and now to back above $70, the price action in the oil market has been a roller coaster for a full decade now, and the question on every trader’s mind is “how far will we rise before dumping again…and what does that mean for other markets?”
From a fundamental perspective, the price of oil has some clearly bullish tailwinds. According to a survey conducted by Reuters, OPEC’s oil output fell to a one-year low of 32.12 million barrels per day last month on the back of declining production in Venezuela and lower shipments from African producers. US President Trump’s decision earlier this month to pull out of the Iran nuclear deal and reimpose sanctions on the country (the world’s fifth largest oil producer) is unlikely to help matters. Meanwhile, on the demand side of the equation, the IMF predicts that global growth will accelerate to a 3.9% growth rate in both 2018 and 2019, which should keep demand for oil products elevated in the near term.
Technically speaking, the oil market remains in a clear uptrend since bottoming in early 2016 and that bullish trend has only accelerated over the last year, with WTI gaining more than 70% off last June’s lows. After rising five of the last six weeks, the commodity is looking stretched in the short term, but given the established uptrend and bullish fundamental picture, traders will likely look to buy any near-term dips.

Source: Trading View, Faraday Research
More broadly, strength in the oil market serves as a harbinger for strength in the broader commodity complex. The Thomson Reuters/Core Commodity CRB Index of 19 commodities has surged to above 200, its highest level since late 2015 and could continue to benefit in the weeks to come. Of course, the so-called “commodity dollars” in the FX market (the Canadian, Australian and New Zealand dollars) could also stand to benefit, though that tailwind has thus far been offset by more cautious monetary policies in those countries.
On a sector level, energy stocks are, not surprisingly, the biggest beneficiary; XLE, the energy sector ETF, is trading up by over 16% off its early March lows and is currently the best-performing major sector on the year. Perhaps less obviously, the consumer staples sector is one of the big losers of the rally in oil. Most of those companies are big consumers of oil and other commodities and often struggle to “pass through” the cost of rising inputs to their customers.

Source: Stockcharts.com, Faraday Research
As gasoline prices cross $3.00 per gallon across much of the US, we expect to hear more about the impact of the oil market on markets and the broader economy this summer. Smart investors are already positioning their portfolios to profit.
Cheers
