CSL Ltd (AX:CSL) Chart Review
CSL Continues Along Long Term Uptrend Towards Record Highs
CSL has experienced a phenomenal run in its share price over the last 5 years as the stock has been able to consistently grow its profits and dividends under its previous CEO who retired last year.
The stock has risen from around the $29 a share mark back in late 2011 to an all time high of around $118
last July. This equates to an approximate 300%+ return over the 5 year span outperforming the local Australian index XJO considerably over the same period.
False Break Of Up Trend
Last November and December was a nervous period for CSL shareholders as the stock had been under a succession of monthly declines after reaching the highs set in July last year. Back in November it appeared the stock had closed below its long term uptrend which was a potential signal to sell based on the chart trend lines.
December trading in CSL initially followed on from its dismal performance in November as it experienced steep losses early in the month indicating that CSL was about to confirm a clear reversal and break its up trend and support level of around $98. However a surge in buying support in the second half of December, saw the stock completely reverse its losses for the month and finish slightly higher on the month. Since it respected $98 support and its trend line it provided a strong bullish signal based on the monthly price action.
January Follow Through Buying
The bullishness continued into January for CSL as the company had made an announcement of a profit upgrade on previous estimates provided by the company. This sent the stock soaring and finished the month at $112.30 on heavy volume, which is another strong bullish sign.
Based on the strong buying support in December and January and momentum rising supporting the rally, CSL is bound to reach its previous all time highs of $118 in the short term.
Note:
Watch the price action over the coming months for a potential reversal to its $98 - $98.50 support level which would signal a break of its 5 year uptrend. This outcome though has a very low probability based on its bullish indicators and price action.

CSL Weekly Chart Review
CSL Confirms Reversal and Close Above Down Trend
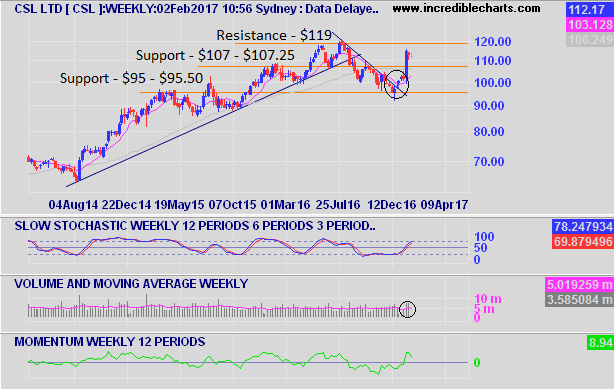
The weekly chart below gives a better indication of sharp V reversal of CSL share price in December, as well as the spike in price in January shown with the most recent long blue candle.
I have circled the area where CSL had closed above the down trend. This was the first signal of a change in sentiment for the stock and direction. If you notice the volume once the reversal in trend occurred was not accompanied by an uptick in volume due to the holiday period so the move could not be relied upon for confirmation. However the volume exploded shortly after in January after the company announcement of a profit upgrade over its original estimates came out.
The recent strong performance of CSL in the last few weeks allowed it to comfortably close above the $107 support level as it now heads for its previous high and resistance of $119 a share. However a failure to hold above $107 on a weekly basis will result in CSL heading back down to the $95 level on the weekly chart.
The weekly chart technicals of CSL are very bullish, with both momentum and stochastic showing strong support for the move higher. In addition the above average volume is also supporting the bullishness of move higher. The most likely move for CSL after reaching the $119 level in the short term, is to make an attempt at a new all time high after a potential brief consolidation at resistance.

Ramsay Health Care Ltd (AX:RHC) Chart Review
Ramsay Healthcare like CSL had also experienced a large move in price over the last 5 years as the stock appeared to mirror CSL's performance over the same period. Ramsay went from around $19 a share in late 2011 to a high of $84 a share reached in September last year producing an impressive 340%+ return over the period. Slightly beating CSL same time frame performance.
Ramsay Breaks Its Long Term Uptrend
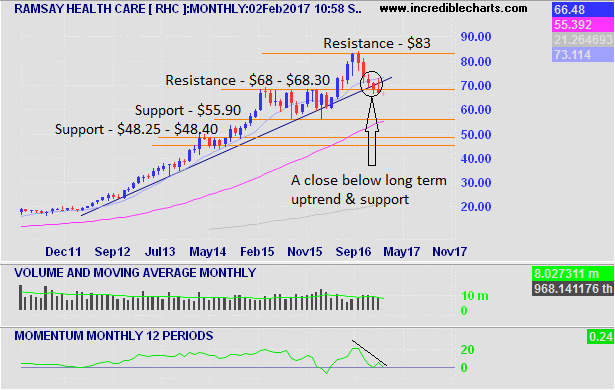
Once Ramsay made the new all time high in September it begun to fall in price following a similar path that CSL had experienced in the second half of 2016. Compared to CSL which was able to respect its 5 year uptrend in December, Ramsay has continued to move lower in December and January. In doing so Ramsay has confirmed a reversal of its long term uptrend in January as it closed below its support level of $68 a share.
Next Stop $56 Support.
Based on the confirmation on the monthly chart closing price in January, Ramsay next move lower is towards a previously strong support level of around $56 a share. Initially over the coming weeks and months. We may see the price move towards its previous support level of $68 though in the short term before it moves lower to its next support level.
Note:
Just like CSL if Ramsay was able to receive some material positive news on the company in the interim we could see the stock reverse the close below its uptrend and support level of $68. If this was to occur a close above its previous long term uptrend on a monthly basis would confirm the move.
Apart from any material news from the company, based on the chart technicals and momentum trending down the performance of Ramsay in 2017 will be weak.
Weekly Chart Review
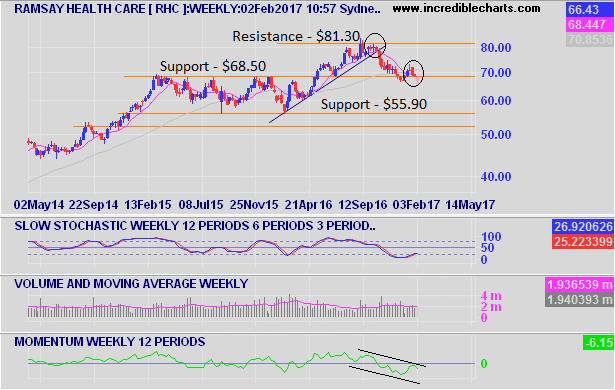
The weekly chart for Ramsay does not provide much change in sentiment and analysis compared to the monthly chart. I have circled the key pivot points for Ramsay recently and resulted shift in trend as a consequence.
The stochastic indicator though is showing a divergence to the direction of the price action, however since its a lagging indicator provided the price continues to fall lower the stochastic indicator will reverse in line with the trend.
If the price in short term was to close above $68.50 on a weekly chart we could see a potential test of the $81.30 resistance level. A move that based on the price and momentum indicator trending down on the weekly chart is unlikely to occur.
The Final Verdict
After reviewing both large cap healthcare stocks recent price action on a monthly and weekly basis, its clear that CSL is clear favorite to outperform in 2017 over Ramsay Healthcare. If CSL's management had not increased its profit estimate last month, CSL could have easily found itself mirroring the sentiment and direction of Ramsay.
Disclaimer: This post was for educational purposes only, and all the information contained within this post is not to be considered as advice or a recommendation of any kind. If you require advice or assistance please seek a licensed professional who can provide these services.


