
Bulls Keep It Together
Picking up where we left off last week, we discussed the sell-off after the initial breakout to all-time highs and the continuation of the bull market rally. To wit:
“Currently, it is pathway #2a which continues to play out fairly close to the prediction from two weeks ago. But it is make, or break, next week as to whether pathway #2b comes into play.
As I have repeatedly noted, we remain primarily allocated in our portfolios. However, we were looking for a pullback to support which holds before increasing our existing holdings further.”
Here is the updated S&P 500 chart through Friday. The market has followed the pathways precisely over the last several weeks.

The pullback to the previous breakout support level did allow us to add further exposure to our portfolios as we said we would do last week.
Next week, the market will likely try and test recent highs as bullish momentum and optimism remain high. Also, with many hedge funds lagging in performance this year, there is likely going to be a scramble to create some returns by year end. This should give some support to the rally over the next couple of months. However, as shown above, the short-term oversold condition which fueled last week’s rally has been exhausted, so it could be a bumpy ride higher.
As I wrote on Tuesday, our current projected short-term target remains 3000 on the S&P 500:
“Regardless of the reasons, the breakout Friday, with the follow through on Monday, is indeed bullish. As we stated repeatedly going back to April, each time the market broke through levels of overhead resistance we increased equity exposure in our portfolios. The breakout above the January highs now puts 3000 squarely into focus for traders.
This idea of a push to 3000 is also confirmed by the recent ‘buy signal’ triggered in June where we begin increasing equity exposure and removing all hedges from portfolios. The yellow shaded area is from the beginning of the daily ‘buy signal’ to the next ‘sell signal.’”
While we are long-biased in our portfolios currently, such doesn’t remain there is no risk to portfolios currently. With ongoing “trade war” rhetoric, political intrigue at the White House, and interest rates pushing back up to 3%, there is much which could spook the markets over the next 45-days.
Moving into next week, we are currently running portfolios primarily unhedged at the moment. We have taken prudent steps in our overall portfolio management process:
- Stop-loss levels have been moved up to recent lows.
- A couple of more defensive positions were added to our equity portfolios.
- With yields back to 3% on the 10-year Treasury, we will also look to add additional exposure to our bond holdings.
We continue to use dips in bond prices to be buyers. This is because the biggest gains over the next 5-years will come from Treasury bonds versus stocks.
This has to do with valuations, and what I want to discuss next.
Which Year Is It?
As noted above, there is little argument the market is bullish. The trend is positive, we just came off of a correction process which has now broken out to new highs. In fact, the 2015-2016 correction, while deeper than the correction earlier this year, had many of the same characteristics. Of course, the Fed was quick to intervene at the bottom of the market in 2016 as concerns of “Brexit” weighed on the market. This year, it was “tariffs” and a stimulus carry through from the slate of natural disasters last year, combined with tax cuts, and a massive increase in Federal spending which provided the necessary liquidity support to drive prices higher.

Looking back further, 2011 also looked much the same. As market turmoil increased following the end of QE-1, the Fed intervened with QE-2 as the Fed fretted over a market decline that would potentially quench the early flames of an economic recovery. That advance ended in 2012 as QE-2 came to its conclusion.

The commonality between 2011, 2015, and 2018 is the extremely loose monetary conditions which have remained a constant throughout. As Jesse Colombo recently noted in his Forbes column:
It is very helpful to adjust the Fed Funds Rate for inflation (known as the “real Fed Funds Rate”) because that is a more accurate way of determining how loose, or tight, monetary policy really is. If inflation is higher than the Fed Funds Rate, that means that the real Fed Funds Rate is actually negative. To put it simply, negative real interest rates mean that interest rates do not compensate for inflation well enough, so capital tends to flow from savings or other conservative investments into rapidly-rising speculative assets.

Negative real interest rate environments are the most conducive to the formation of dangerous economic bubbles. The only time in recent decades that the U.S. has experienced negative real interest rates for a significant amount of time was during the mid-2000s housing bubble and during the current bubble period that started after 2009.”
However, that is changing. As Michael Hartnett at BofA notes:
“Indeed, so far the tailwind from global QE is still here, and has resulted in record global EPS, 4% US GDP, $1.5tn US tax cuts, $1tn stock buybacks… yet poor 2018 returns.”
Yes, the market is up almost 10% for the year, but should be up much more given the current liquidity backdrop.
However, the “end of excess liquidity” is in the works:
“End of excess returns: CB’s bought $1.6tn assets in 2016, $2.3tn 2017, $0.3tn 2018, will sell $0.2tn in 2019; liquidity growth turns negative in Jan’19 for 1st time since GFC.”
As the Fed continues to hike rates and reduce their balance sheet (QT), monetary policy is being tightened as liquidity is being drained from the system. While investor confidence remains high, which is essential to providing the operating room necessary for the Fed to hike rates, the similarities between today and 1998 may be a much better comparison.

During that period, there was an early correction during the Fed’s rate hiking campaign as a result of Long-Term Capital Management, a massive hedge fund, imploding. It was an early warning sign that went unheeded by the Fed and the markets that higher rates were beginning to take their toll.
We saw the same with Bear Stearns in 2008. Again, economic data seemed strong at the time, markets hiccuped and quickly escalated back to new highs, investors assumed the upward trend would continue. Of course, we would find out several months later, when the economic data was negatively revised, Bear Stearns was also a warning sign the economy was already deep into a recession.
Today, the similarities to 1998 and 2008 are much more aligned:
- The Fed is tightening
- The U.S. is decoupling from the rest of the world
- The yield curve is flattening
- Emerging markets are declining
- Hedge funds and quant-strategies are under-performing.
- Debt and leverage, the two areas most affected by higher rates, are at record levels.
And, once again, the Fed is on a mission to hike rates under the assumption they will know when to stop. Unfortunately, they are batting ZERO in that endeavor as every time previously something “broke” first.
Doug Kass also noted on Friday:
“Reactionary technicians find the markets to be titillating (scoffing at the anticipation of untoward fundamentals) and unconcerned about reward v. risk or, arguably rising economic ambiguities (low interest rates and a narrowing yield curve), the unprecedented lack of cooperation between world powers (in a flat and interconnected world), large public and private debt loads, the unstable political setting, the failure of fiscal policy to trickle down, the divergence between the S&P Index and other world (emerging) markets, orange and black swans and the global pivot of monetary policy.
In particular, the fact that the rising wave of debt and central bankers’ liquidity injections have failed to produce steady wage growth and productive investments in the real economy go unnoticed by those that worship at the altar of stock price momentum.
And I will remind everyone, what caused the ten percent correction in late January/early February was the rise in interest rates. Well, today, we are right back a fresh ten year high in the yield on the two year note and the ten-year Treasury yield is back to 2.99%.
Both the bull market and the economic recovery are long in the tooth and face the challenges of a pivot in global monetary policy, competition from ever-higher risk-free rates of return (the one-month Treasury bill yields more than 2.00% compared to the S&P 500 dividend yield of about 1.80%) and a number of other possible adverse outcomes in the economic, political and policy spheres.”
Importantly, as we noted last week, it is Emerging Marktes which may well be the “canary in the coal mine.”

(In 2000, 2007 and 2012, emerging markets warned of an impending recessionary drag in the U.S. (While 2012 wasn’t recognized as a recession, there were many economic similarities to one.)
This feels a whole lot more like 1998 than 2011 or 2016.
Don’t mistake what I am saying.
Just because it “feels like” 1998, doesn’t mean we are going to sit in cash and wait for the inevitable crash. The best run of the markets are always the last leg of the advance to the peak. As Dr. Robert Shiller noted on Friday:
“The stock market could get a lot higher before it comes down. It’s highly priced, but it could get much more highly priced. It’s a risky market now,”
The point is to be AWARE of the risk, have a strategy, and most importantly have the discipline to act when the evidence suggests the markets have ended their bullish trend.
It will happen.
Just not today. So, for now we remain fully allocated to the markets.
We will let you know when that changes.
See you next week.
Market and Sector Analysis
Data Analysis Of The Market and Sectors For Traders
S&P 500 Tear Sheet

Performance Analysis

ETF Model Relative Performance Analysis

Sector and Market Analysis:
As I noted last week:
“Despite the markets breaking out to all-time highs last week, there is definitely signs of rotation from previously leading sectors of the market to the laggards. This is shown below in the 10-week relative-rotation graph which compares performance relative to the S&P 500 index.”
Despite the rally in the market, there was continued deterioration among the leadership sectors. Money did rotate a bit into some of the beaten down international markets, along with Finance, Industrials and Healthcare (defensive.) Weakening and lagging sectors continue to expand which does give us short-term caution on the market.

Sector-by-Sector

Industrials were the clear winner last week as the 50-dma crossed above the 200-dma. Despite the threat of trade wars and tariffs, investors chased industrial stocks looking for a place to flee too from declining energy and technology shares.
Discretionary, Technology, and Staples – all performed better this week as well. After taking profits there is little to do now except wait for an opportunistic entry point to add further exposure.
Healthcare and Utilities – as noted above, maintained their strength. The momentum chase is alive and well and despite higher rates, investors are back “chasing yield” in sector that is particularly interest rate sensitive. Continue to use pullbacks to support, and oversold conditions, to add exposure accordingly.
Financial, Energy, and Materials – continue to lag the rest of the market. Despite a recent tick up in oil prices, Energy’s recent slump continues and again tested the 200-dma and is testing the overhead 50-dma a second time. The trend in the energy sector has turned negative but a break above the 50-dma next week could change that. A tradeable opportunity will present itself if that occurs. Stops should remain at the recent lows. Financials continue to languish along support but not showing much in the way of strength to support overweighting the sector currently.
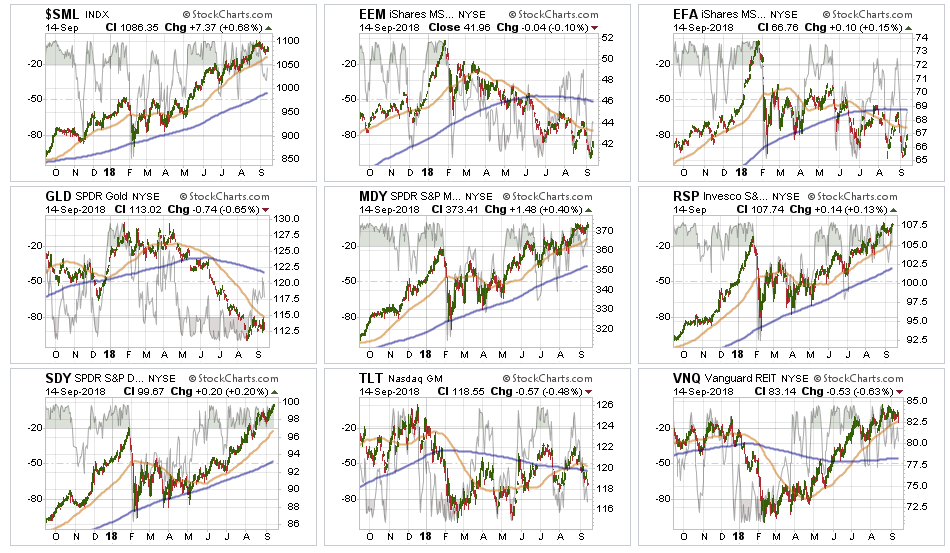
Small-Cap and Mid-Cap we noted three weeks ago that these markets were extremely overbought and extended, and a pullback to support was needed. Mid-cap has performed better but is short-term overbought. We continue to hold our target exposure and will look for opportunity as it comes.
Emerging and International Markets as I noted last week.
“The recent bounce again failed at the declining 50-dma. Positions should have been sold on that failed rally. Stops at the recent lows were triggered on Friday and suggest positions be closed out as lower levels are likely at this time.”
Both sectors rallied a bit last week, providing an opportunity to reduce exposure for the time being and reallocate that capital to better performing areas. WHEN international and emerging markets begin to perform more positively we will add positions back to portfolios. There is just no reason to do so now.
Dividends, Market and Equal Weight – we added a pure S&P 500 index fund to our “core” holdings which will add some beta to the portfolio but acts as a placeholder for sectors and markets we have no allocation to (ie, international markets, gold, basic materials.) We continue to hold our allocations to these “core holdings” and continue to build around these core with tactical positions that provided opportunistic advantages.
Gold – failed at the 50-dma this past week. This was your opportunity to sell your gold holdings for the time being. Stops remain firm at $111 again this week.
Bonds – bonds sold off on Friday which was surprising since there were NO signs of inflation in the latest economic reports. However, bonds are once again very oversold on a short-term basis and sitting on support. We are adding bonds to portfolios at current levels and lower. Stops are set at $115.
REITs got oversold last week as rates picked up a bit. With the sector back on the 50-dma a decent trade is available with a stop at $82.50 and continued upside on a break above $84.
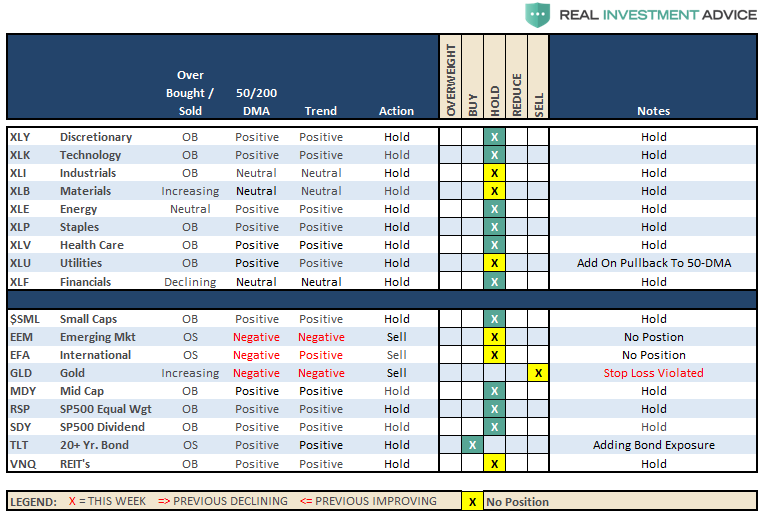
The table below shows thoughts on specific actions related to the current market environment.
(These are not recommendations or solicitations to take any action. This is for informational purposes only related to market extremes and contrarian positioning within portfolios. Use at your own risk and peril.)
Portfolio/Client Update:
Over the last several weeks, I have discussed the increases to equity exposure in portfolios as the market’s momentum has continued to push higher. However, we have done this cautiously by using pullbacks to support, which then subsequently broke out above resistance, to do so.
Last week, the market was able to hold above the “breakout” levels once again, so last week we added exposure as have repeatedly discussed over the last several weeks. We took the following actions in Client accounts:
- New clients: Add 50% of target equity allocations.
- Equity Model: Semiconductors (Micron Technology (NASDAQ:MU) and KLA-Tencor Corporation (NASDAQ:KLAC)) are on “Sell Alerts” – we will monitor closely and stop-loss levels have been tightened up. We added positions in Johnson & Johnson (NYSE:JNJ), CVS Health Corp (NYSE:CVS), NKE, FedEx FDX, Duke Energy Corporation (NYSE:DUK), PEP, and WMT. We also brought existing positions up to full weight where needed.
- Equity/ETF blended – Same as with the equity model.
- ETF Model: We overweighted our core “domestic” indices by adding a pure S&P 500 index ETF to offset lack of international exposure. We remain overweight outperforming sectors to offset underweights in under-performing sectors.
- Option-Wrapped Equity Model – We added PEP and JNJ to the portfolio and brought existing positions up to full-weights as needed.
Again, we are moving cautiously and we are well aware of the present risk. Stop loss levels have been moved up to recent lows and we continue to monitor developments on a daily basis. With the trend of the market positive, we want to continue to participate to book in performance now for a “rainy day” later.
It is important to understand that when we add to our equity allocations, ALL purchases are initially “trades” that can, and will, be closed out quickly if they fail to work as anticipated. This is why we “step” into positions initially. Once a “trade” begins to work as anticipated, it is then brought to the appropriate portfolio weight and becomes a long-term investment. We will unwind these actions either by reducing, selling, or hedging, if the market environment changes for the worse.
THE REAL 401k PLAN MANAGER
The Real 401k Plan Manager – A Conservative Strategy For Long-Term Investors
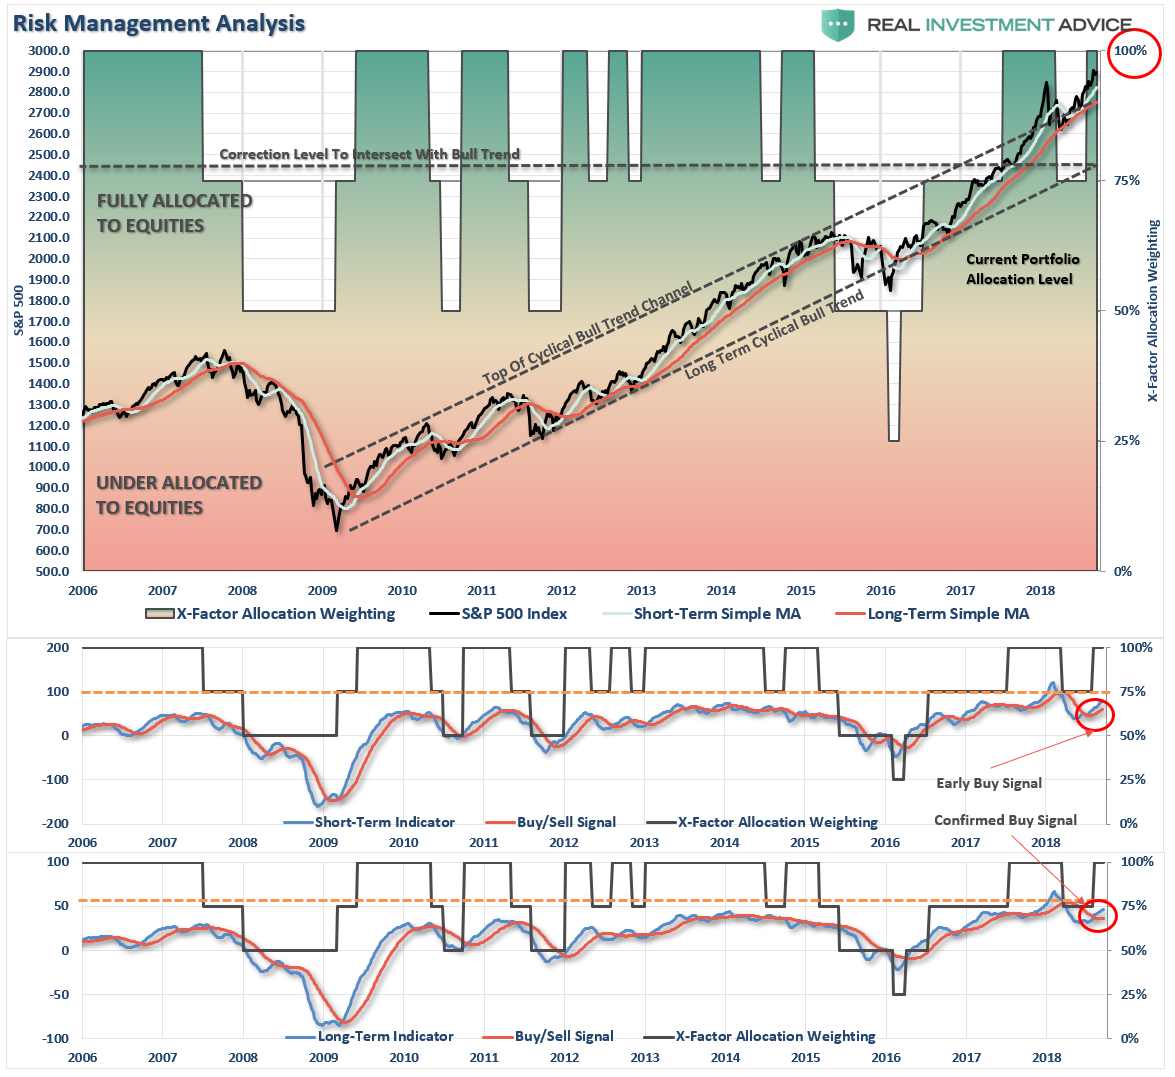
There are 4-steps to allocation changes based on 25% reduction increments. As noted in the chart above a 100% allocation level is equal to 60% stocks. I never advocate being 100% out of the market as it is far too difficult to reverse course when the market changes from a negative to a positive trend. Emotions keep us from taking the correct action.

Back To Full Weights
As I wrote last week:
“Over the last several weeks we have been discussing the issue of the breakout to new highs. We also noted that by the times these things happen the risk/reward set up is not optimal to increase equity exposure immediately. We have been suggesting waiting for a bit of “September” weakness to increase equity positions to full target weights. That weakness occurred last week, and any further weakness into early next week, which doesn’t violate support, will give us an opportunity to add exposure accordingly.”
Last week, we used the pullback to support to increase 401k allocations back to full-weights. The following guidelines can be used now:
- If you are overweight equities – reduce international and emerging market exposure and add to domestic exposure if needed to bring portfolios in line to target weights.
- If you are underweight equities – increase exposure towards domestic equity as you feel comfortable. There is no need to go “all in” at one time. Step in on any weak days.
- If you are at target equity allocations currently just rebalance weights to focus on domestic holdings.