In spite of a stock market sell-off that nearly set the S&P 500 back 10%, some stock ETFs have already recovered. That’s right. A handful of funds barely trembled during last week’s frightful liquidation. Shortly thereafter, this intrepid group ascended to record heights.
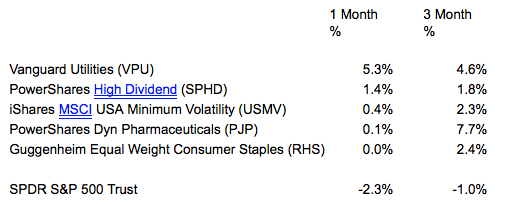
Here are the more notable stock ETFs on the latest 52-Week High list. Do the 1-month and 3-month performance intervals hint at a pattern?

Most investors are familiar with the carnage on a month-over-month basis. And most are relieved that both Janet Yellen, chairwoman of the Federal Reserve, as well as the president of the ST. Louis Fed, James Bullard, backstopped Wall Street investors last week. In light of low inflation and global economic weakness, they strongly hinted that the Federal Open Market Committee (FOMC) would consider maintaining zero interest rate policies for a longer period,
Yet many investors may not have realized the lack of momentum for broader benchmarks over a 3-month span. The Dow 30, the S&P 500 and the Russell 2000 have all turned in losing performances. In contrast, non-cyclical segments that are not particularly tethered to the U.S. economy – consumer staples, utilities, health care – have turned in positive results with less drawdown or volatility.
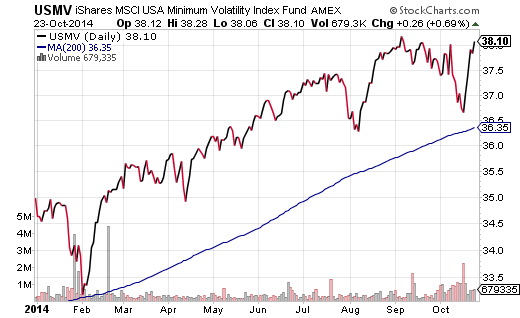
Speaking of volatility, iShares MSCI USA Min Volatility (NYSE:USMV), has been one of my favorite funds throughout 2014. This exchange-traded asset tracks the results of an index composed of U.S. equities that, collectively, possess less volatile characteristics than the broader market. Indeed, this “low-vol” fund has been a stand-out success in the late-stage stock bull. What’s more, it is one of a precious select number of stock ETF assets that did not breach a respective 200-day trendline in October.
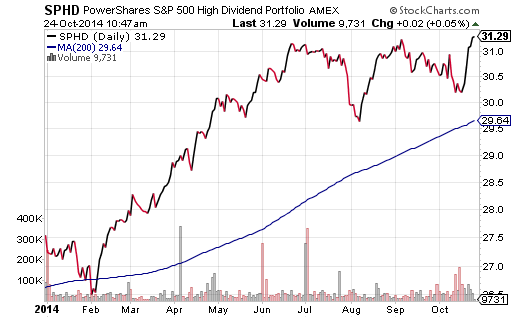
Are there other stock funds that maintained the long-term technical uptrend without a dip? S&P 500 High Dividend Portfolio (NYSE:SPHD) managed this feat, bouncing off a “higher low” before traveling to a brand new perch. And wouldn’t you know it… SPHD pursues investment returns that correspond to the price and yield of a “low volatility” index called the S&P 500 Low Volatility High Dividend Index.
Stay Conservative
Is there a definitive take-away from market instability over the last month as well as market inconsistency over the last three months? Yes. Specifically, conservative stock choices are providing more reasonable rewards for the risk. You might prefer to select a non-cyclical sector with an allocation to utilities, staples or health care. By the same token, you might like a more diversified approach that targets low volatility, dividend-oriented assets.


