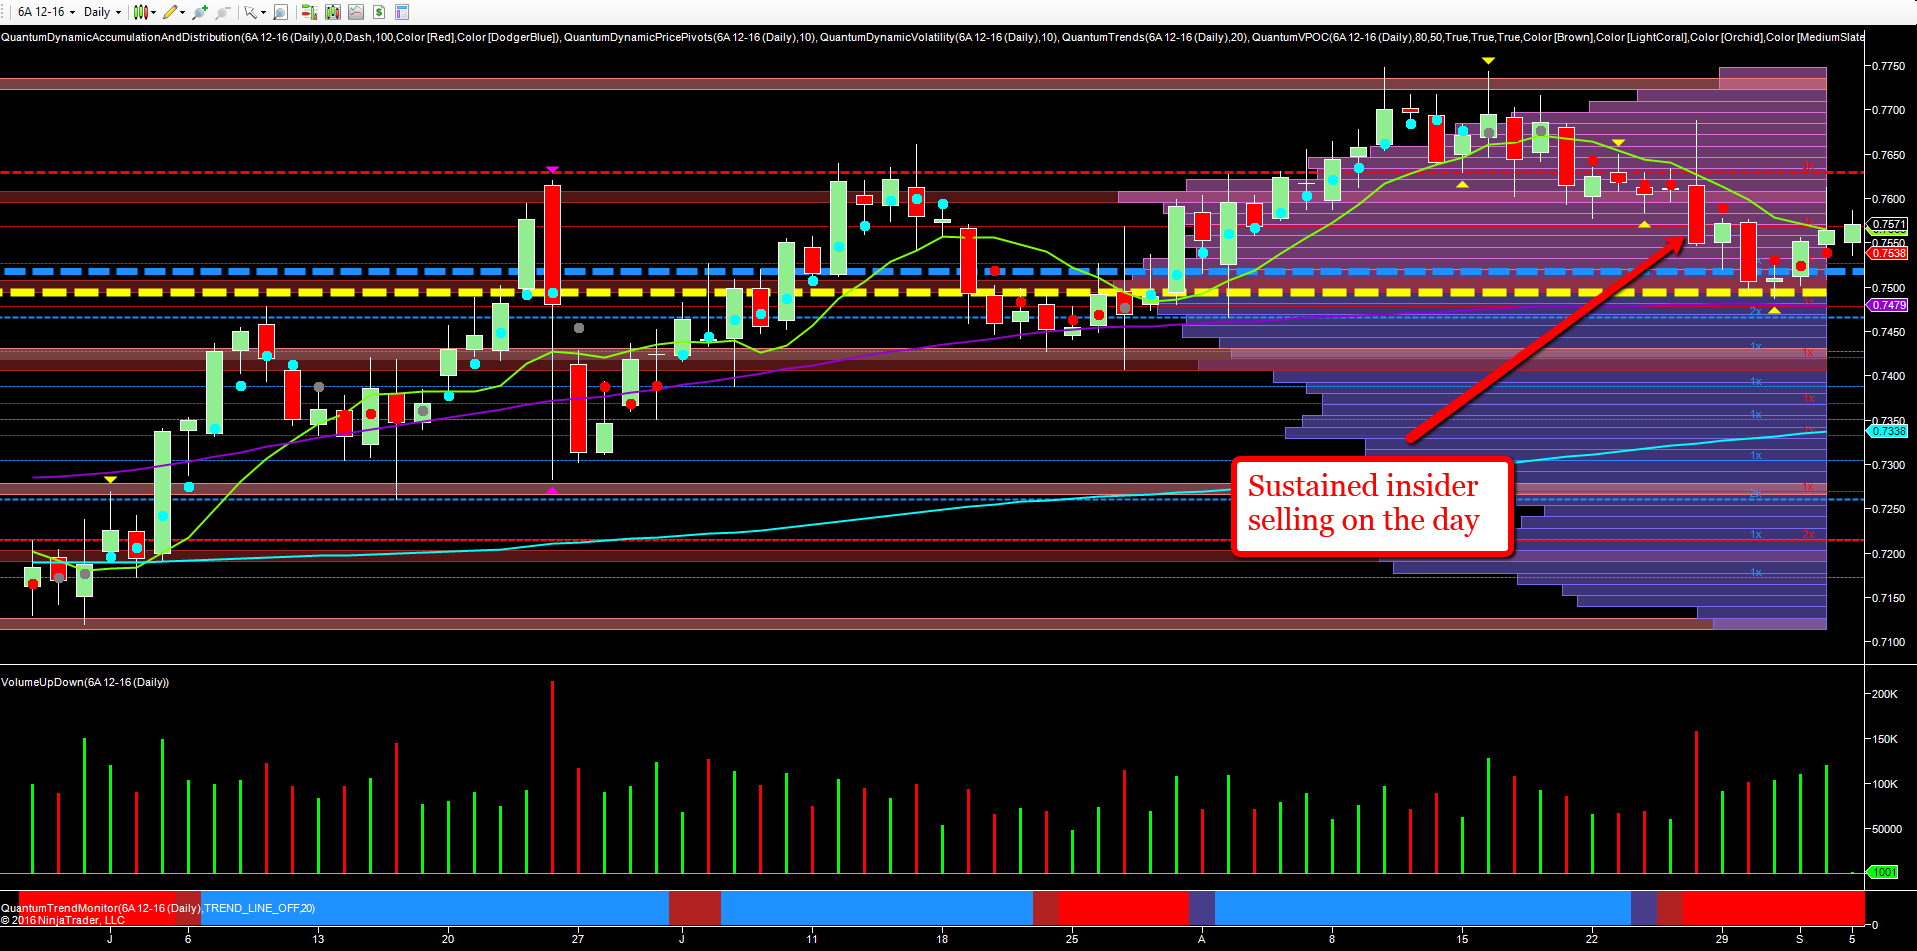
August was a month of almost perfect symmetry for the Aussie dollar, with the bullish sentiment of the first half, duly replaced with equally bearish sentiment in the second half, as the 6A contract tested the highs of 0.7750 before returning to close back near the start at 0.7500. Indeed this is a key level with the volume point of control residing here, but with volumes building to either side, particularly in the 0.7625 region supported by a secondary high volume node.
Below, we also have sustained volumes in the 0.7400 as the congestion builds around the VPOC, and until we see a strong move away from this region, we are unlikely to see any development of trend soon. The trend monitor continues to remain bearish for the time being, with the sustained insider selling clearly in evidence on the 26th August, with the pair closing dramatically lower on very high volume, and with a deep wick to the upper body of the candle.
Since then we have seen further weakness, with rising volume on Friday but again no follow through to the upside on the NFP release. Overnight we have the RBA statement and interest rate decision, and with the economic outlook remaining very mixed, a further cut seems unlikely following so closely on the decision last time around.
Positioning in the futures market shows a very minor reduction in net longs, and merely confirms the current sideways price action.

The British pound continues to defy everyone, making fools of the IMF and all the other doom-mongers in Europe, whilst continuing to delight the Brexiteers with our new PM leading the way. The petty nature of the current crop of European and US leaders was demonstrated once again at this weekend’s G20 meeting where she was placed at the far end of the second row of the leaders’ photo call.
She appears to be able to rise above the snub, and will merely deliver the coup de grace in due course and leave Europe to its own devices. Surprisingly the world has not collapsed, nor indeed has the pound or the British economy, with all three PMI releases, namely manufacturing, services and construction all coming in much higher than expected.
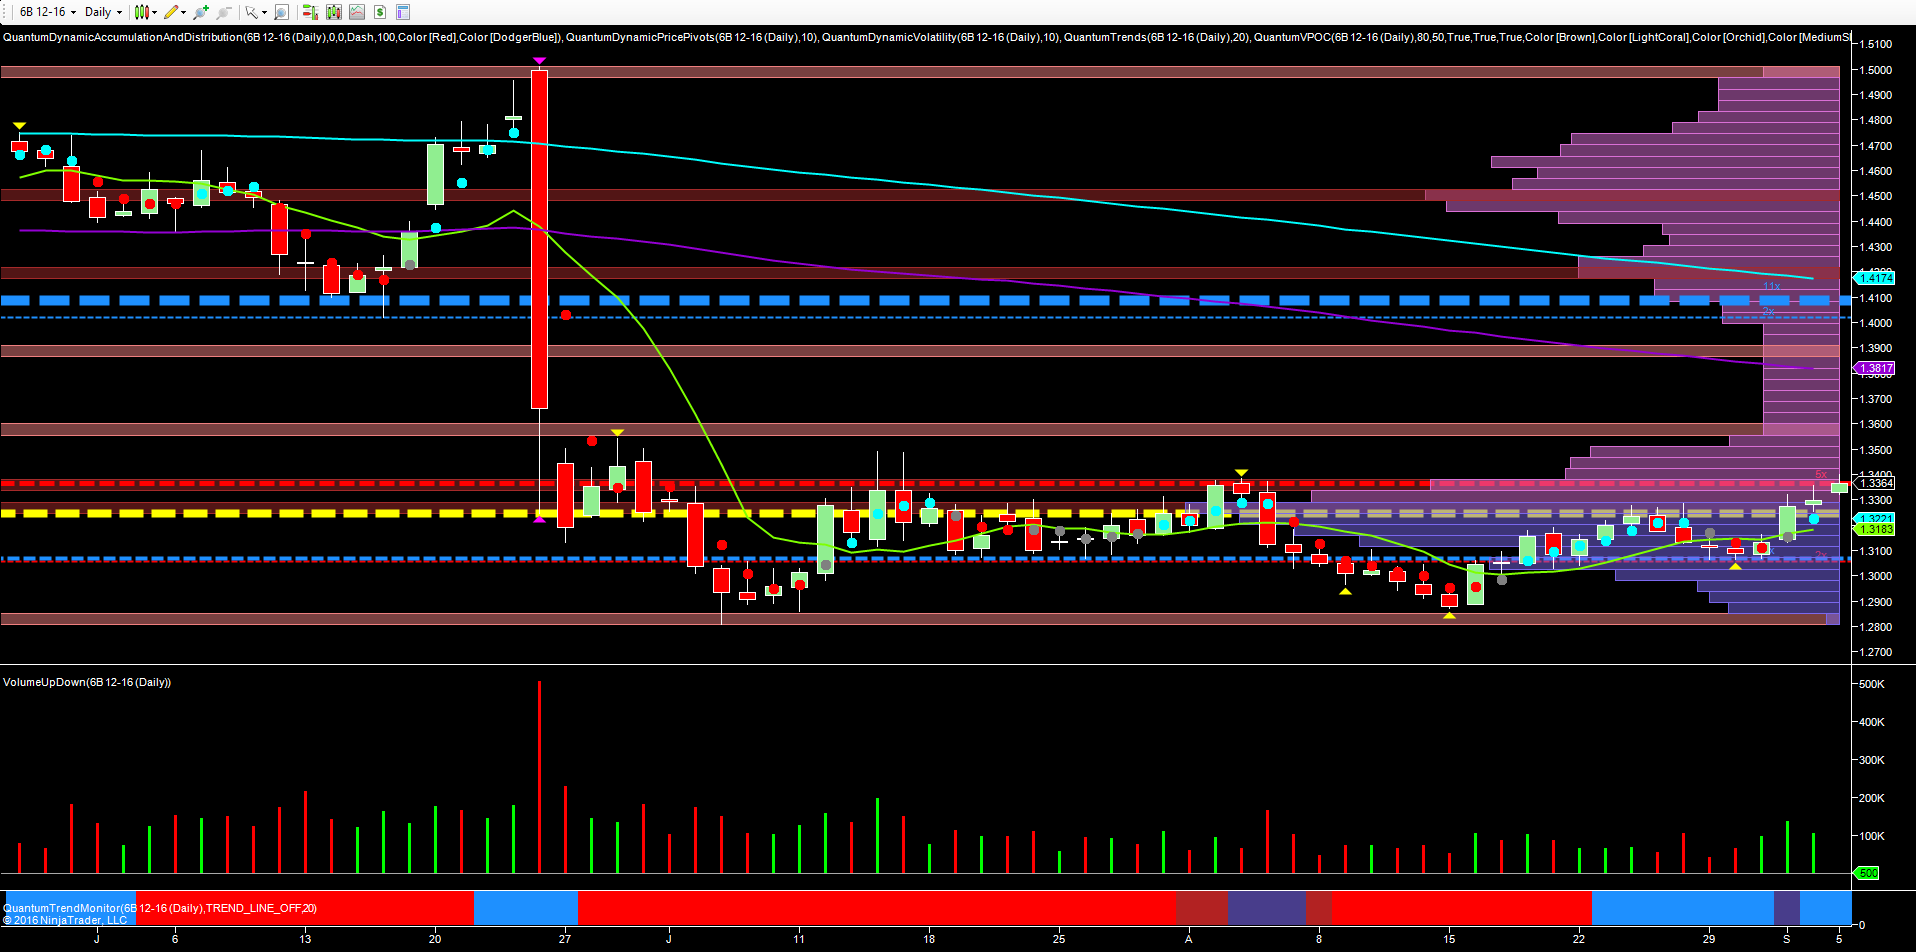
From a technical perspective, cable is now approaching and testing a key area at the 1.3380 price point, which has seen distribution in the past as detailed with the red dotted line, and for further upside momentum to be maintained, this levels need to be taken out.
Much will depend on the FED later in the month, but once above this area, we then have a strong technical platform in place to deliver the springboard for a further move higher. Our trend monitor continues to remain blue, and supportive of this move higher.

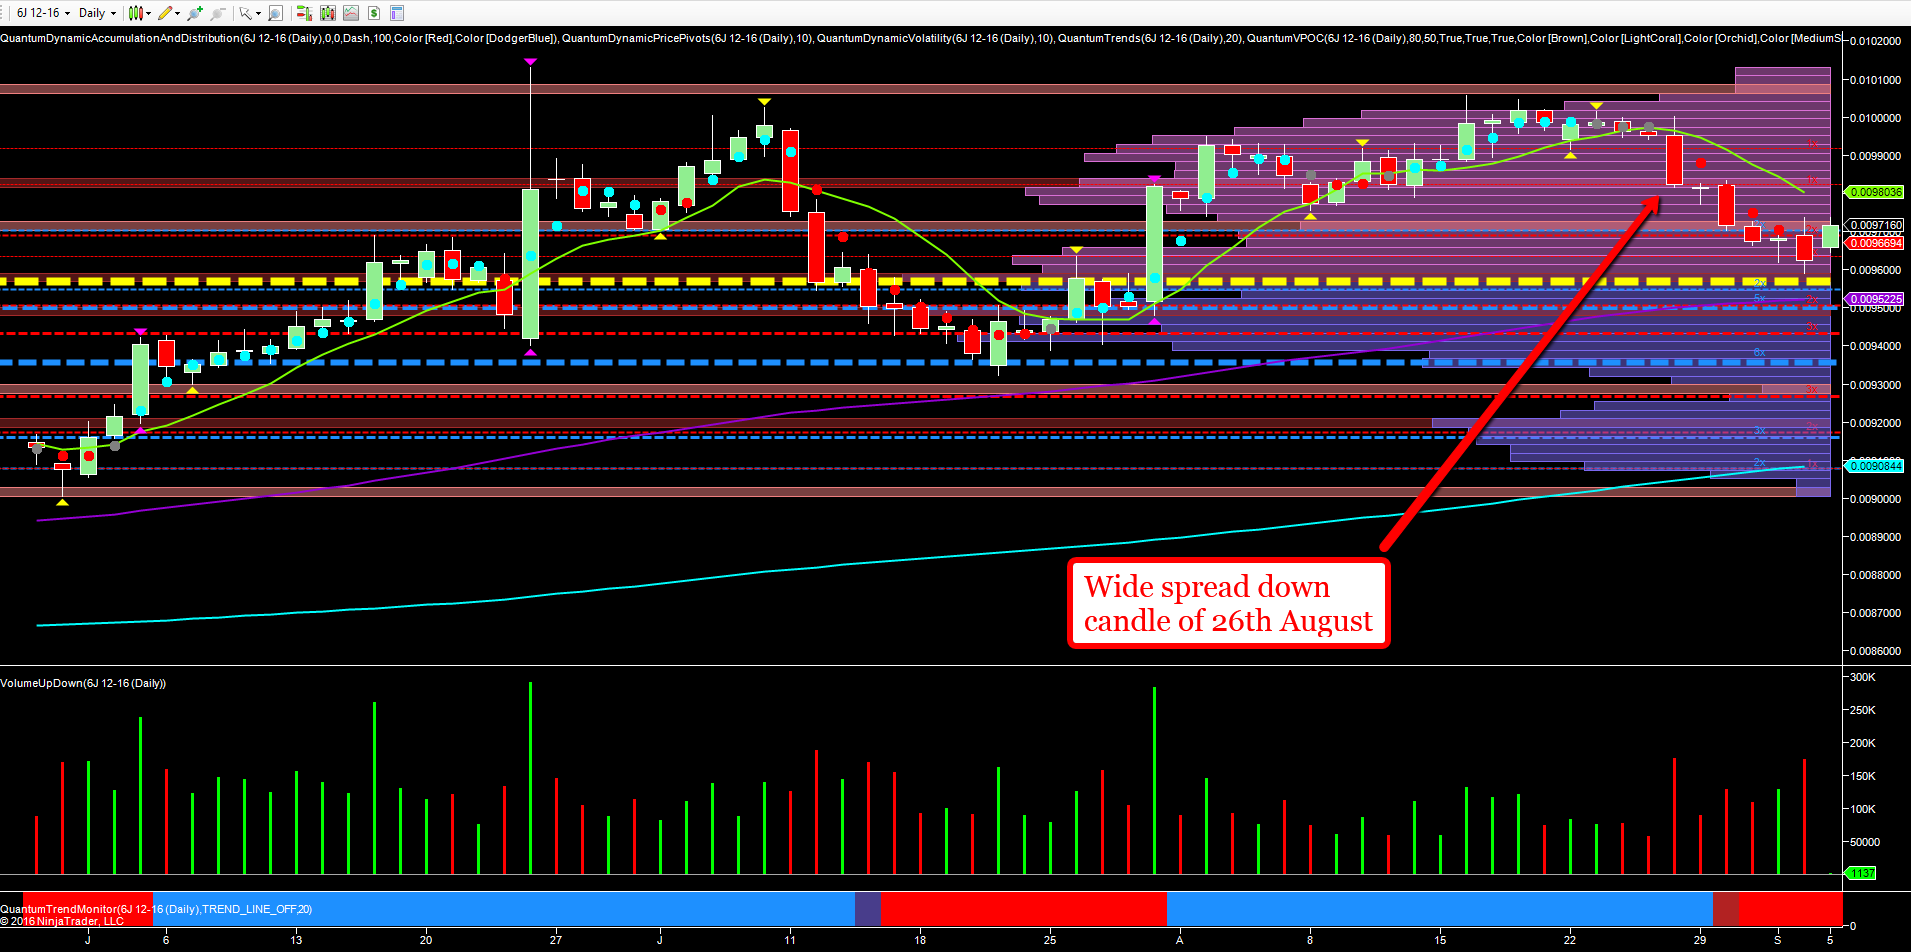
Finally to the JPY/USD on the daily chart, and here it was the 0.01000 area which proved a bridge too far for the pair, as yen weakness returned once more following the slap the market delivered to the BOJ and the government in late July.
The weakness in the pair was self evident in mid August with the spreads narrowing and upside volume falling, before duly rolling over on the wide spread down candle of the 26th August, and further confirmed moving into September. At the same time, the trend monitor has now transitioned to red, and confirming the bearish picture as we return to test the volume point of control which sits in the 0.009600 area.
Below we have several potential areas of support which may come into play in due course, and as always, should the fundamental picture deteriorate further, Kuroda et al will be waiting in the wings. However, given the reaction last time around, nothing is guaranteed, and all we can be certain of is any return of yen strength will not be welcomed.
