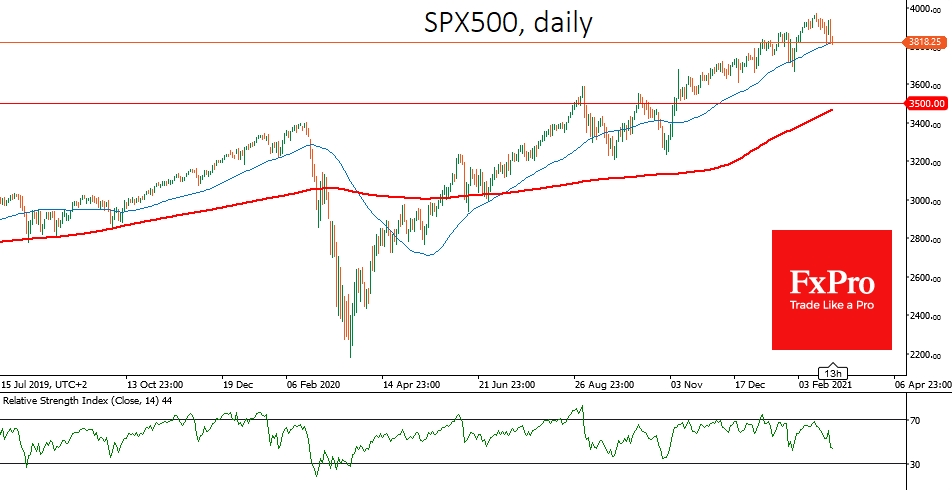
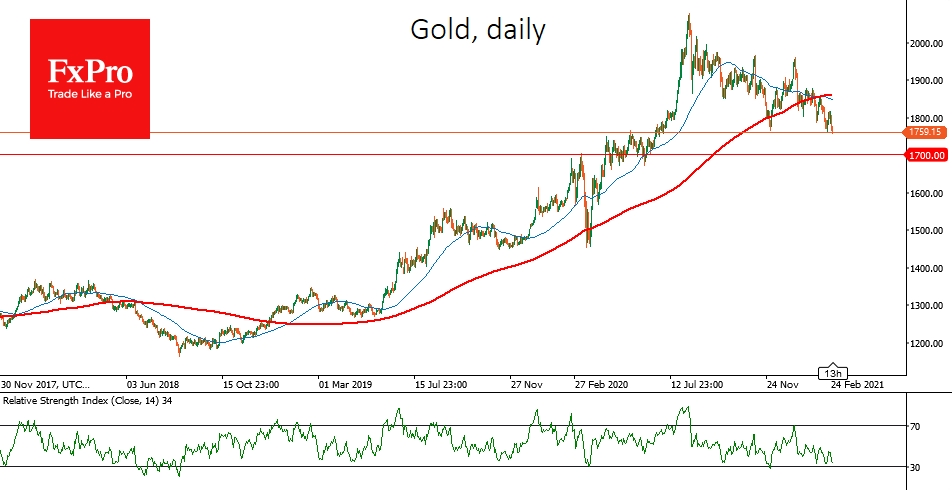
Pressure returned to the markets on Thursday, led by high-tech companies, causing a 3.5% plunge in the NASDAQ and pushing back the S&P 500 by 2.5% and the Dow Jones by 1.75%. Asian bourses continue with a 3%+ decline on Friday. Gold rewrote eight months lows, trading at $1760 on Friday morning. The pressure on equity and gold markets increases with the continued sell-off in debt markets, where yields on 10-year US government bonds exceeded 1.6% yesterday.
Rising yields in the US, European and Japanese debt markets have sharply reduced risk assets' attractiveness. Currencies and emerging markets were hit especially hard yesterday. Currencies such as the Mexican peso, South African rand and Turkish lira lost more than 3% intraday.
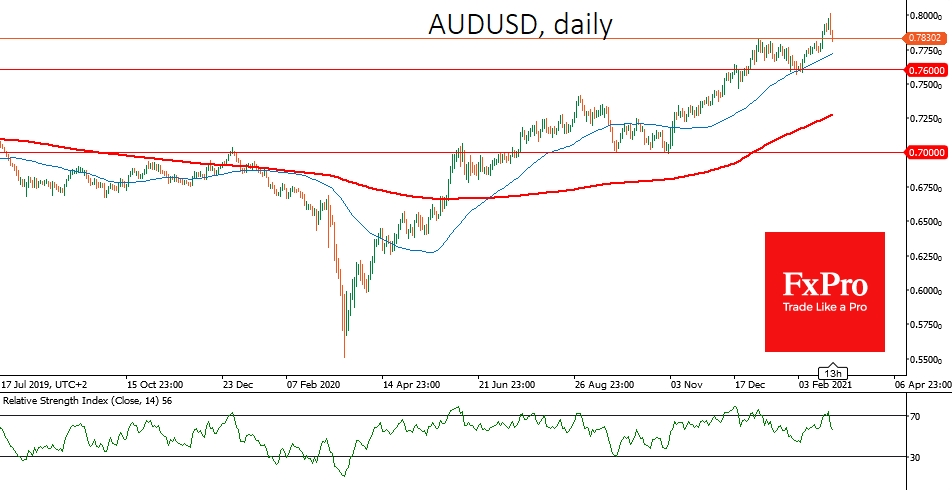
Commodity-related currencies failed to gain above significant round levels against the dollar as AUD/USD retreated to 0.7820 after going above 0.8000, while USD/CAD is up to 1.2620 after updating 3-year lows at 1.2470.
The conventional wisdom is that rising bond yields in developed markets increase their attractiveness by sucking capital out of other markets. But so far, this has not been enough, as debt markets remain under pressure and yields continue to rise.
As we noted earlier, Powell's comments have not calmed the markets as they do not promise an increase in bond purchases. However, a new bailout package of up to 1.9 trillion from the government is on the way. Perhaps the sharply increased volatility will force the Fed to change its mind about its programs to support the economy by injecting more money into the markets.
Still, we may be merely witnessing a shake-out at the end of the month and purchases of risky assets will resume in March. In this case, it is worth paying attention to the crossing of several red lines, which will intensify the sell-off.
The S&P 500 is trading at 3800, which is close to the 50-day average. A consolidation well below this line, like a year ago, would increase the volatility and widen the sell-off. The next target of the correction then could then be 3500, near where the 200-day average passes.
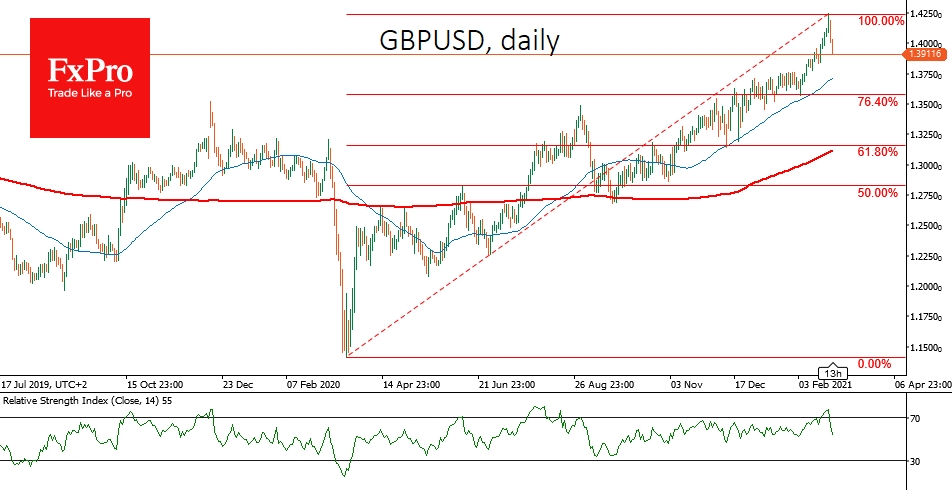
A breakdown of GBP/USD under 1.3850 would soon open the way to 1.3600. The most pessimistic scenario now appears to be a pullback of GBP/USD to 1.3100.
AUD/USD, after the unsuccessful test of 0.8000, can roll back to 0.7600 quite quickly, especially if it continues to be helped by the increase in QE from the RBA, as occurred recently. A deeper target for the correction seems to be 0.7000.
EUR/USD is about to test support at 1.2100, and after that, the pair might see little buying up to 1.1800.
For gold, the next significant level is $1700, a failure under which would be a complete surrender of the bulls that pushed the price up for two years through to August 2020. 
The FxPro Analyst Team
- English (UK)
- English (India)
- English (Canada)
- English (Australia)
- English (South Africa)
- English (Philippines)
- English (Nigeria)
- Deutsch
- Español (España)
- Español (México)
- Français
- Italiano
- Nederlands
- Português (Portugal)
- Polski
- Português (Brasil)
- Русский
- Türkçe
- العربية
- Ελληνικά
- Svenska
- Suomi
- עברית
- 日本語
- 한국어
- 简体中文
- 繁體中文
- Bahasa Indonesia
- Bahasa Melayu
- ไทย
- Tiếng Việt
- हिंदी
Where Are The Targets Of Correction As Market Sell-Off Widens?
Published 02/26/2021, 04:15 AM
Updated 03/21/2024, 07:45 AM
Where Are The Targets Of Correction As Market Sell-Off Widens?
Latest comments
Install Our App
Risk Disclosure: Trading in financial instruments and/or cryptocurrencies involves high risks including the risk of losing some, or all, of your investment amount, and may not be suitable for all investors. Prices of cryptocurrencies are extremely volatile and may be affected by external factors such as financial, regulatory or political events. Trading on margin increases the financial risks.
Before deciding to trade in financial instrument or cryptocurrencies you should be fully informed of the risks and costs associated with trading the financial markets, carefully consider your investment objectives, level of experience, and risk appetite, and seek professional advice where needed.
Fusion Media would like to remind you that the data contained in this website is not necessarily real-time nor accurate. The data and prices on the website are not necessarily provided by any market or exchange, but may be provided by market makers, and so prices may not be accurate and may differ from the actual price at any given market, meaning prices are indicative and not appropriate for trading purposes. Fusion Media and any provider of the data contained in this website will not accept liability for any loss or damage as a result of your trading, or your reliance on the information contained within this website.
It is prohibited to use, store, reproduce, display, modify, transmit or distribute the data contained in this website without the explicit prior written permission of Fusion Media and/or the data provider. All intellectual property rights are reserved by the providers and/or the exchange providing the data contained in this website.
Fusion Media may be compensated by the advertisers that appear on the website, based on your interaction with the advertisements or advertisers.
© 2007-2024 - Fusion Media Limited. All Rights Reserved.
