Get 40% Off
⚠ Earnings Alert! Which stocks are poised to surge?
See the stocks on our ProPicks radar. These strategies gained 19.7% year-to-date.
Unlock full list

When Is The Best Time To Buy Stellar Lumens?

Published 01/13/2019, 11:59 PM
Updated 07/09/2023, 06:31 AM

XLM/BTC Technical Analysis


Looking at the XLM/BTC's daily chart, notice that the pair has been mainly ranging in the past year, bouncing up and down between key pivot levels 0.000040 and 0.000028. In the past few days, it’s been testing the lower levels once again, with no luck in breaking below it. If history is to repeat itself, we could indeed see a bounce back up towards 0.000040.

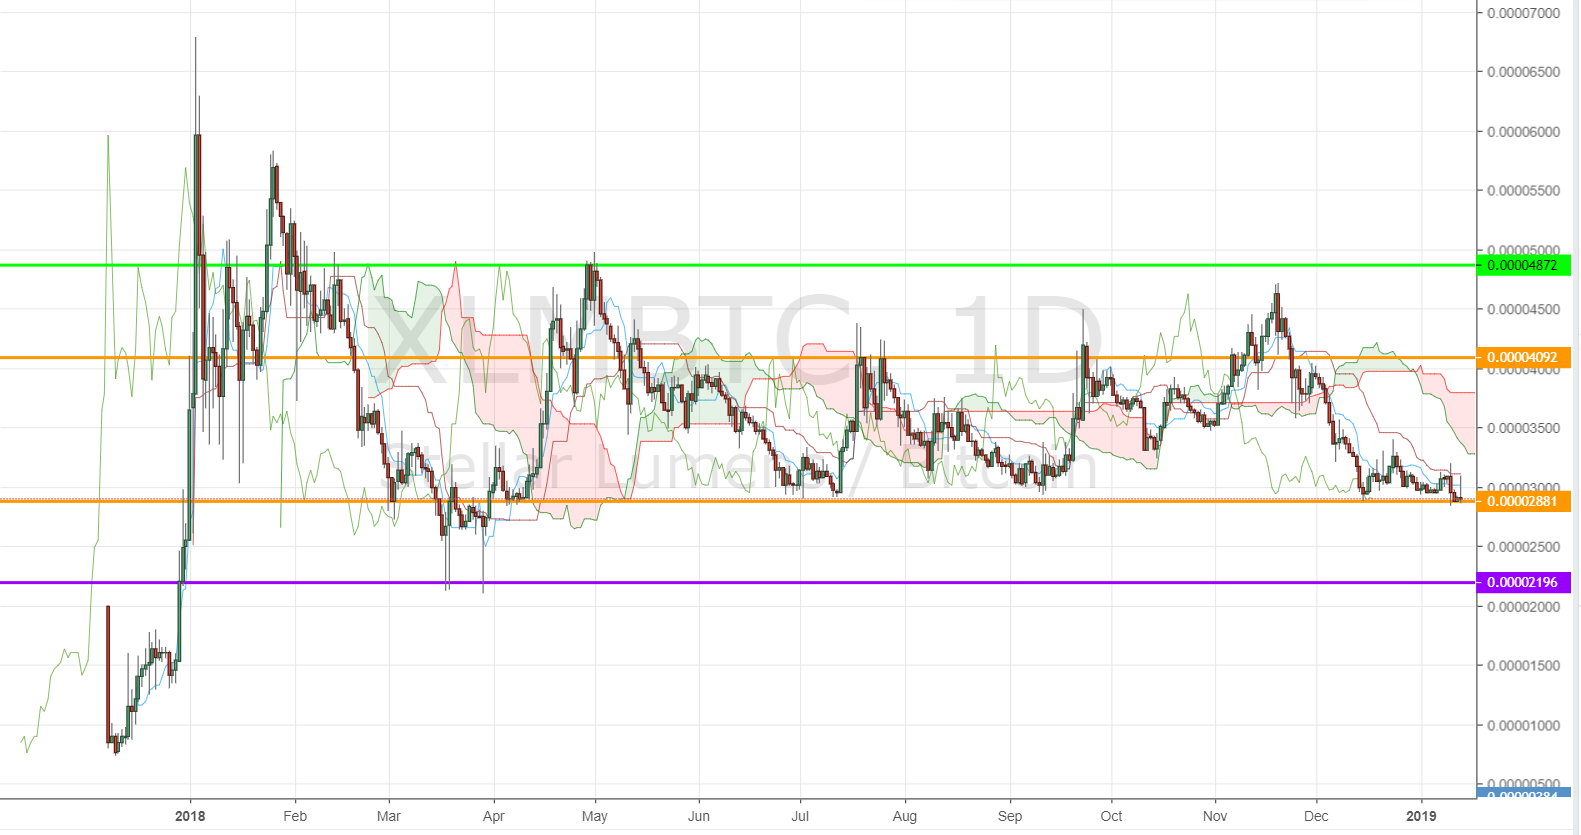
Stellar Lumens - XLM/BTC Technical Analysis

However, if the pair succeeds in breaking the lower pivot level, that could open doors for further drops towards the key support and lows of March 2018, at 0.000021, which could be an even better buying opportunity. Keep in mind that the pair also has a thick Ichimoku cloud acting as strong resistance.

Of course, you need to only invest the money you can afford to lose in the volatile crypto markets and make your purchases proportionate to your risk tolerance.

Remember that as the 4th point of the IDDA technique, you must calculate your risk tolerance before deciding on the investment strategy that is suitable for your portfolio. Don't forget to complete your risk management due-diligence before developing your investment strategy.

Original Post

Latest comments

hi
Risk Disclosure: Trading in financial instruments and/or cryptocurrencies involves high risks including the risk of losing some, or all, of your investment amount, and may not be suitable for all investors. Prices of cryptocurrencies are extremely volatile and may be affected by external factors such as financial, regulatory or political events. Trading on margin increases the financial risks.
Before deciding to trade in financial instrument or cryptocurrencies you should be fully informed of the risks and costs associated with trading the financial markets, carefully consider your investment objectives, level of experience, and risk appetite, and seek professional advice where needed.
Fusion Media would like to remind you that the data contained in this website is not necessarily real-time nor accurate. The data and prices on the website are not necessarily provided by any market or exchange, but may be provided by market makers, and so prices may not be accurate and may differ from the actual price at any given market, meaning prices are indicative and not appropriate for trading purposes. Fusion Media and any provider of the data contained in this website will not accept liability for any loss or damage as a result of your trading, or your reliance on the information contained within this website.
It is prohibited to use, store, reproduce, display, modify, transmit or distribute the data contained in this website without the explicit prior written permission of Fusion Media and/or the data provider. All intellectual property rights are reserved by the providers and/or the exchange providing the data contained in this website.
Fusion Media may be compensated by the advertisers that appear on the website, based on your interaction with the advertisements or advertisers.
© 2007-2024 - Fusion Media Limited. All Rights Reserved.