We return to USD/JPY and the Nikkei today as the warnings are getting more frequent and the probability of seeing prices breaking downwards has increased. Nikkei futures pushed lower than 14,000 yesterday, only to bounce from 13,900—only a few points higher than their important lows at 13,850. USD/JPY also reached 101 support and bounced higher towards 101.50 later in the day. US equities rallied yesterday but the enthusiasm was not followed in USD/JPY.
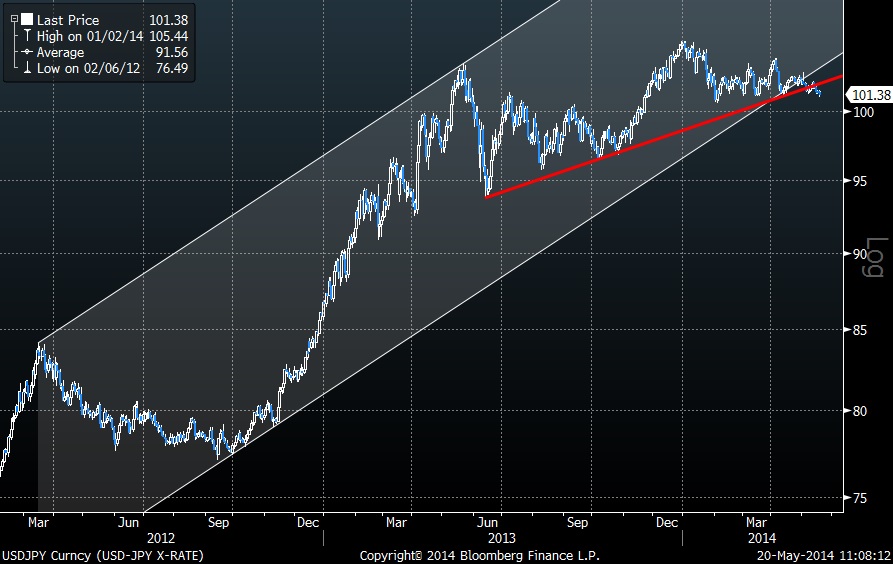
As shown in the chart below, USD/JPY has broken the long-term upward sloping channel and the red trend line support. With long-term support levels broken, there is huge downward potential for this pair, at least toward the lower range of the previous triangle near 94.
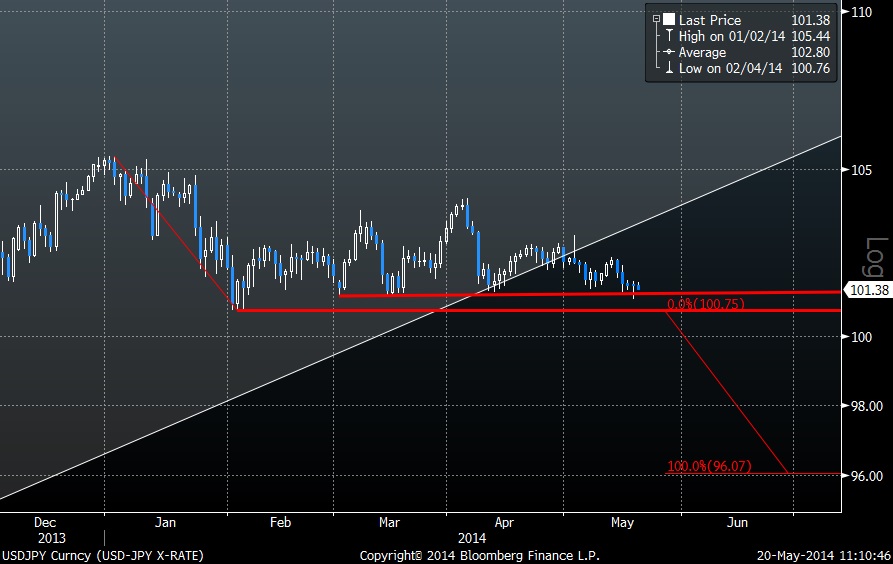
Although the USD/JPY pair looks weak, it is still holding above the 101 and 100.60 support levels. Breaking below 101 will be the start of a large decline that could push it towards 96.
The last time we saw such a decline in the USD/JPY was when the Nikkei fell from 16,000 to 13,850.
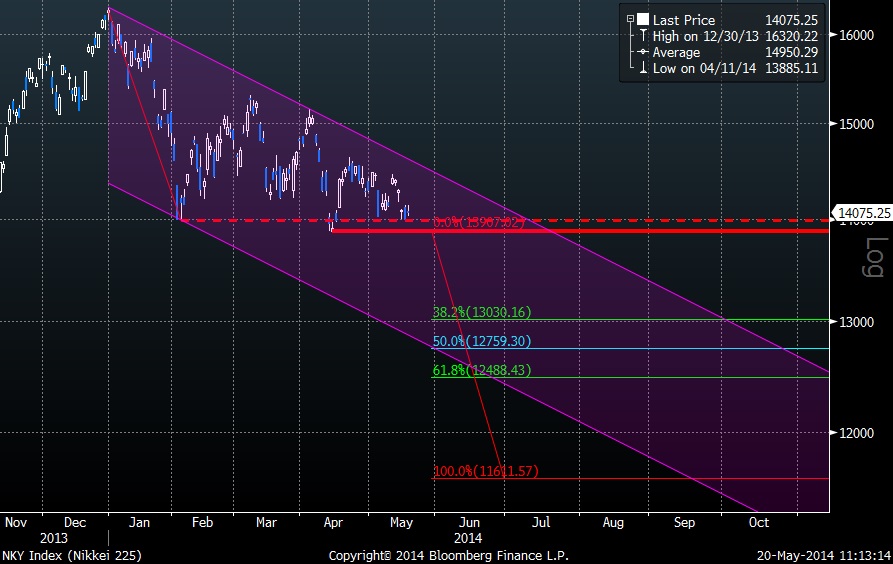
So how is the Nikkei reacting to yen strength? The Nikkei is also testing its important lows at the 13,850-14,000 price level. A break below this area is very possible and could push the index straight to 13,000.
Longer-term targets can be found lower, but we will talk about them after and if we first reach 13,000.
The Nikkei is inside the purple downward sloping channel, as shown in our chart above, and I believe that it is only a matter of time before we see prices break below support and accelerated selling pushing this index in the 13,500 area. Keeping an eye on USD/JPY and the Nikkei is important as a possible breakdown will have bearish implications for the rest of the world equity markets. The divergence between US equities and the Nikkei and USD/JPY suggests that either US equities are expected to make a deep correction or Asia will hold its support levels and bounce strongly upward. Taking into account the RSI divergences we have witnessed for some time now in US indices, I expect the bearish scenario to come true.
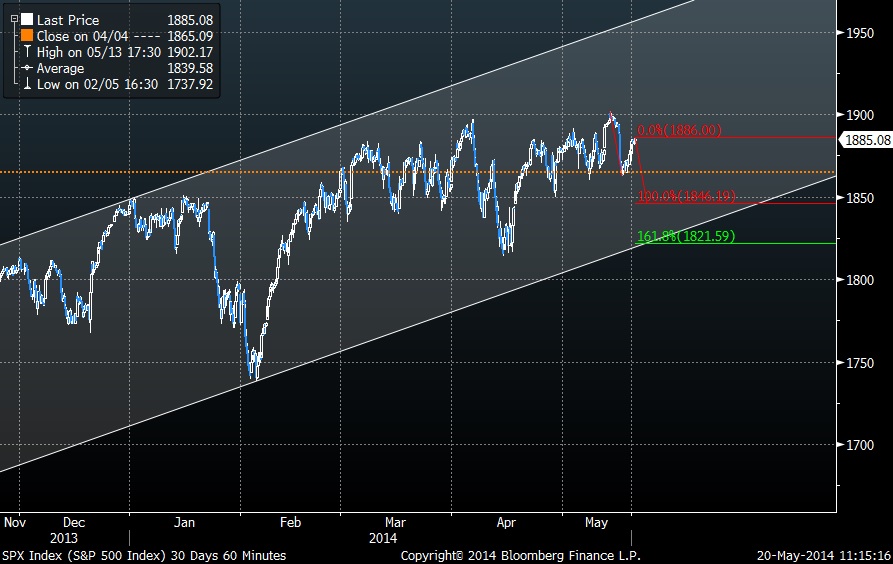
The S&P 500 has moved up from 1,814 which is far from impulsive. Wave structure is complex and contains overlapping waves. I believe this is an upward corrective move and soon we should see price pull back towards the longer-term, upward-sloping white channel. I expect the S&P to move at least toward 1,840-45 or most probably toward 1,810-20.

A break of the upward-sloping white channel will mean that the correction will be deeper and the index could re-test 1,740 lows. Until then, bulls should be very cautious and not overconfident. Stops should be raised as the warnings from Asia are worrying.
Disclosure: None of the information or opinions expressed in this blog constitutes a solicitation for the purchase or sale of any security or other instrument. Nothing in this article constitutes investment advice and any recommendations that may be contained herein have not been based upon a consideration of the investment objectives, financial situation or particular needs of any specific recipient. Any purchase or sale activity in any securities or other instrument should be based upon your own analysis and conclusions.


