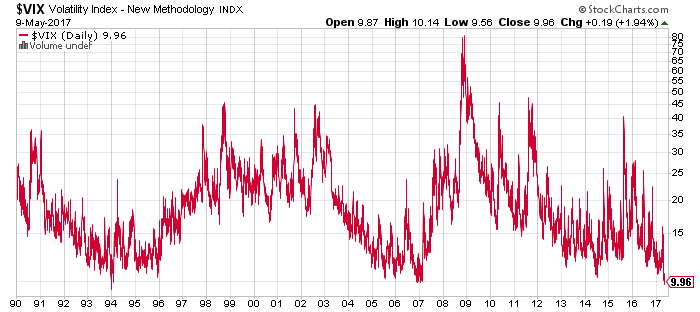
The so-called fear gauge of the US equity market – the VIX Index — fell to a two-decade low this week. Analysts are divided on what it means. By some accounts, it’s the calm before the storm. But others say it’s a sign that the good times will roll on, at least for a while.
Let’s dig a bit deeper into this debate by reviewing some of the recent analysis on the calm that’s swept over the stock market. But first, let’s recap the latest numbers.
The VIX, which measures the implied volatility on the S&P 500 via index options on the benchmark, is currently just a hair above its lowest level since the early 1990s.
Other measures of stock market volatility confirm that the S&P has become unusually tranquil of late. Measuring vol by way of the rolling 30-day standard deviation of daily returns, for instance, tells a story of a placid market. Ditto for profiling S&P volatility with a Garch (1,1) model, using either a normal distribution or a Student’s t distribution to capture a degree of the fat-tails effect. By almost every measure, market vol is extraordinarily low these days.
The question is why? Neil Irwin at The New York Times writes that the market is “weirdly calm,” offering some thoughts on the source of the serenity. One possibility is “the advent of products that let people easily bet on the VIX and other volatility indexes may be distorting their prices, and there have been changes in how major investors are hedging their portfolios against losses that may be making the index artificially low.”
The slide in volatility strikes some (most?) analysts as odd, given the state of world affairs these days. “I’ve been very surprised that the VIX is this low because, from a macro and geopolitical perspective, it probably could be double,” says Eric Weigel, managing partner at Global Focus Capital.
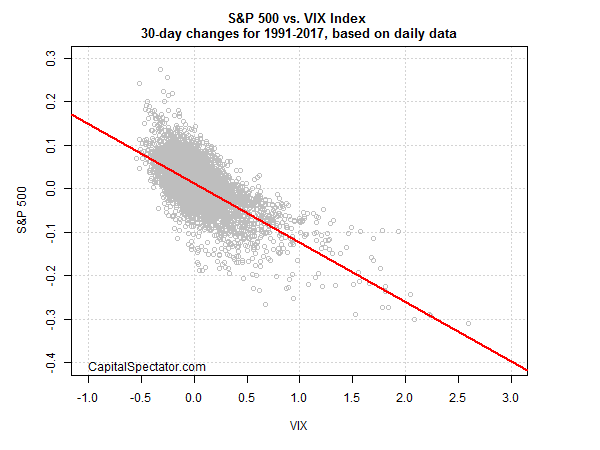
Higher volatility implies lower stock prices. Indeed, there’s a strong inverse relationship between market returns and changes in the VIX. In other words, positive (negative) changes in equity prices tend to be associated with negative (positive) changes in the VIX, as the regression chart below illustrates.
The bigger question is what does a low-vol regime imply for stocks now? Analysts are of two minds, largely because two main empirical facts are linked with the history of market volatility. On the one hand, volatility tends to cluster, which means that the arrival or low vol tends to endure. Ditto for high vol. As Benoit Mandelbrot observed in his seminal paper (“The variation of certain speculative prices”) on the subject, “large changes tend to be followed by large changes, of either sign, and small changes tend to be followed by small changes.”
But clustering isn’t permanent and so regime shifts also routinely show up in the history market volatility sooner or later. Low vol, in other words, tends to give way to high vol, and vice versa, on a semi-regular basis. The challenge is deciding when one regime is about to give way to another. History isn’t terribly helpful on this front. A low vol regime can persist for months or even years.
Nonetheless, some analysts are recommending that it’s time to start planning for a change in the risk landscape. “In the short term, investors can enjoy this run, but they should start to hedge their positions and look for safety,” advises Christian Magoon, chief executive at Amplify ETFs.
Michael Arone, chief investment strategist at State Street Global Advisors, observes that low vol “usually doesn’t end in a slow walk-back. It usually ends in a spike in volatility and an event,” adding that “those events are incredibly hard to predict.”
Meanwhile, another analyst notes that “the more volatility gets compressed, the more volatility expands when it is released” via Nigol Koulajian, the chief investment officer of Quest Partners, a hedge fund. “When something happens, it’s going to be really bad . . . Volatility has become completely useless as a measure of risk.”
The alternative view is that low vol is signaling that the crowd is pleased with the economic outlook. The combination of low US recession risk and expectations for firmer growth in the second quarter and beyond is keeping volatility low.
“There aren’t a lot of major concerns on a fundamental basis to move volatility to a higher level,” says Ernie Cecilia, chief investment officer at Bryn Mawr Trust.
Nonetheless, if you’re sitting on substantial gains courtesy of the bull market in recent years a bit of hedging and/or rebalancing looks prudent at the moment. Don’t mistake that for a forecast about the market or vol. Rather, it’s all about making wise risk-management decisions, and sometimes, perhaps most of the time, those decisions have a contrarian bias. The current climate just happens to be one of those times.


