To date, 2018 has been a particularly rough year for investors in US treasury bonds.
After starting the year with a yield near below 2.5%, the benchmark 10-year bond has seen yields surge to a high of nearly 3.05%, corresponding to about a year-to-date drop of about 3% in IEF, the equivalent treasury bond ETF. Not surprisingly given its higher duration, the 20+ year treasury bond ETF (NASDAQ:TLT) has seen an even more severe 5% loss so far in 2018. While moves like these may represent just a bad month in the stock market (and a bad hour in the über-volatile crypto market!), the magnitude of this year’s moves has rattled the normally staid bond market.

Source: Stockcharts.com, Faraday Research
It’s also worth noting that, by and large, the surge in rates has not spread to most other developed markets. Yesterday, the 10-year spread between US treasuries and German bunds reached 2.43%, the highest level on record. The relative yield advantage is a big factor (along with lopsided positioning) in driving EUR/USD to hit a fresh 2018 low below 1.1850 so far today.
In addition to its substantial impact on every other asset class, the bond market has a well-earned reputation for being the “smartest” market, so what is the run-up in U.S. yields telling us? The most obvious explanation is that U.S. inflation is well and truly turning a corner (Friday’s weak wage-growth figure notwithstanding), and traders are demanding a higher “term premium” to compensate them for the risk of rising prices. If this view is correct, the Federal Reserve will likely be forced to raise interest rates at least twice more this year, followed by another several hikes in 2019.
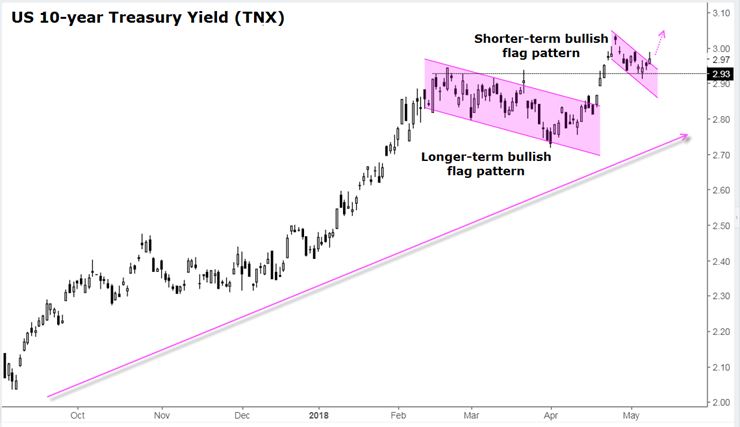
Turning our attention back to the benchmark 10-year treasury bond yield, rates have surged from near 2.00% eight months ago to test 3.00% as of writing. From a technical perspective, the sharp rally from the September 2017 lows to February’s high near 2.90%, followed by the shallow, controlled pullback to 2.75%, created a “bullish flag” pattern; incidentally, the shorter-term rally-and-controlled-pullback off the April lows has created a similar pattern.

Source: TradingView, Faraday Research
As the name suggests, these patterns represent healthy corrections within the context of a bull market in yields (bear market in bonds). The fact that the February/March resistance level at 2.93% provided support on this month’s dip confirms that the uptrend is intact and suggests that interest rates are likely to continue their rise as we head into the summer. If that bullish yield (bearish treasury bond price) scenario plays out, we would expect to see a continuation of the recent dollar strength, while higher-yielding stocks and sectors may struggle to compete. By contrast, a break below the April low near 2.72% would throw the bullish yield / bearish bond thesis into question.
The world’s largest and “smartest” market influences price action across the investment universe, so it pays to have a roadmap and key signposts to watch along the way, regardless of what you’re trading!
