- US energy policy shifts- Less output on the horizon
- Nearby NYMEX crude oil futures rise to a new high and break out to the upside
- Higher lows in natural gas
- Crude oil production declines in the US- OPEC helps the rally
- Natural gas inventories are falling compared to prior years
Crude oil and natural gas markets are readjusting after falling to all-time and quarter-of-a-century lows in 2020. On April 20, 2020, the NYMEX crude oil price dropped to negative $40.32 per barrel, the lowest price since WTI began trading in the early 1980s. As storage facilities filled, there was nowhere to put the energy commodity. The seaborn Brent benchmark futures fell to the lowest level of this century at $16 per barrel.
In late June, natural gas reached $1.432 per MMBtu, the lowest price since 1995.
Since then, prices have recovered. Optimism over the end of the global pandemic that caused demand to evaporate lifted oil and gas prices. Meanwhile, record levels of central bank liquidity and government stimulus increased the global money supply, planting inflationary seeds in the world financial system.
In early 2021, the US transition of power from the Trump administration to President Joe Biden with his party’s control of both houses of Congress changed global production dynamics.
Crude oil and natural gas prices have moved higher over the past months, and that trend looks likely to continue. The United States Oil Fund (NYSE:USO) and the United States Natural Gas Fund (NYSE:UNG) are ETF products that move higher and lower with a portfolio of oil and gas futures contracts.
US energy policy shifts: Less output on the horizon
On his first day in office, US President Joe Biden canceled the Keystone XL pipeline project that transports crude oil from the oil sands in Alberta, Canada, to the US. With both houses of the US Congress in the hands of the President’s political party, the odds of a greener energy policy agenda are high.
Increased regulations and a shift towards alternative energy sources will decrease US output. The previous administration advocated for US oil and gas production to achieve independence from the Middle East and other world producers. The current policy path will alter US energy dynamics.
Nearby NYMEX crude oil futures rise to a new high and break out to the upside
The path of least resistance for the oil price remains higher as of Mar. 5.

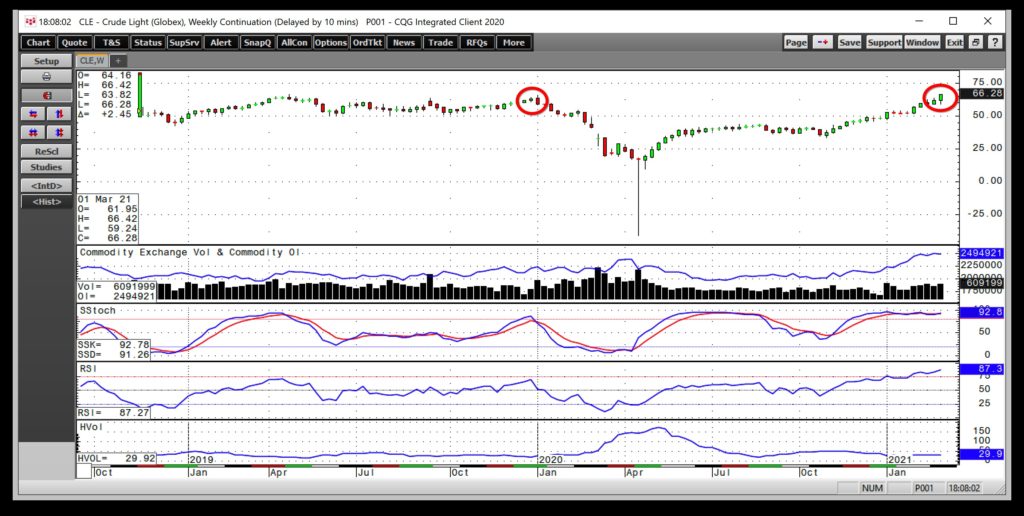
The weekly chart of NYMEX crude oil futures highlights the energy commodity rose to a new and higher high last week at $66.42 per barrel. Crude oil conquered the 2020 $65.65 peak on March 5. The next target is nearby at $66.60, the April 2019 high.
Open interest, the total number of long and short positions in the NYMEX oil futures market stood at nearly 2.5 million barrels, up from the two-million-barrel level in early November when the energy commodity reached a low of $33.64 and resumed its upward trajectory that began in April 2020 with the all-time low. Price momentum and relative strength indicators remain in overbought conditions. Weekly historical volatility at 2.9% reflects the slow and steady climb of oil’s price.
Higher lows in natural gas
In June 2020, natural gas futures fell to the lowest level in a quarter-of-a-century when the nearby contract traded to $1.432 per MMBtu.

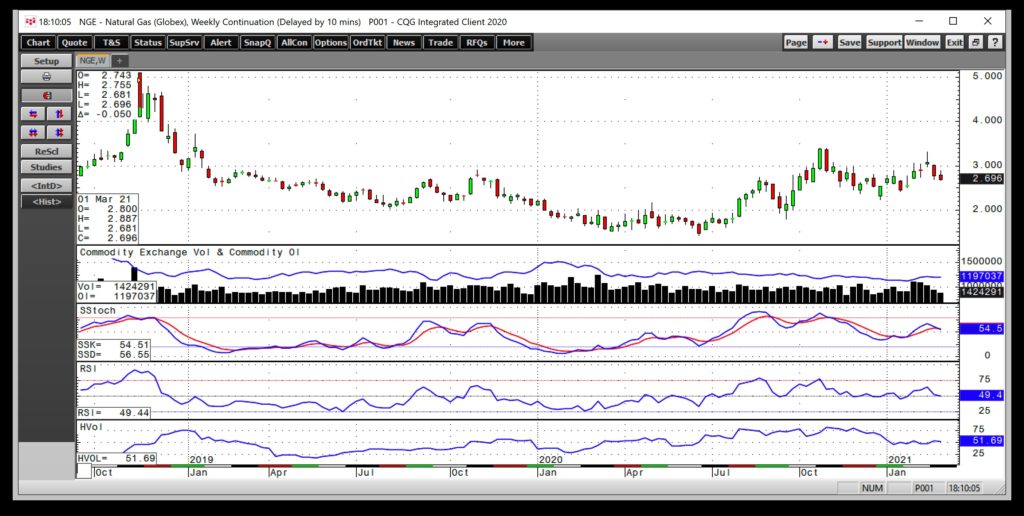
Since then, natural gas has made a series of higher lows. While the open interest metric declined from over 1.3 to just below the 1.2 million contract level, the drop is likely a function of seasonal factors. In early March, the natural gas market is looking towards the offseason for demand when injections into storage begin to climb later this month.
Weekly price momentum and relative strength indicators were on either side of neutral readings as of Ma. 5. Weekly historical volatility has been holding steady at over the 50% level in 2021 but has declined from over 80% in early November at the start of the peak season for demand.
Crude oil production declines in the US; OPEC helps the rally
US crude oil production reached a record high of 13.1 million barrels per day in March 2020. According to the Energy Information Administration, daily output was running at 10.0 mbpd as of the week ending on February 26, a decline of 23.7% on a year-on-year basis.
The shift in US energy policy will likely cause the record from March 2020 to stand for the foreseeable future as the regulatory environment now supports even lower production levels for the coming months and years.
While alternative energy sources may eventually lead to US energy independence, the short-term impact hands some of the pricing power back to OPEC, the international petroleum cartel, and the Russians. Last week, OPEC+ decided to leave the current production policy intact despite the price rise. Saudi Arabia will continue its voluntary cut.
The move could squeeze US consumers as the economy emerges from the pandemic. In an interview on CNBC, the Saudi oil minister told a reporter, “Drill-baby-drill is dead,” in the US in a sign that OPEC+ now has increased pricing power in the oil market. The cartel’s members would rather sell fewer barrels at a higher price than more at a lower one. Crude oil futures rallied to a new high above the 2020 peak in the aftermath of OPEC’s latest output decision.
Natural gas inventories are falling compared to prior years
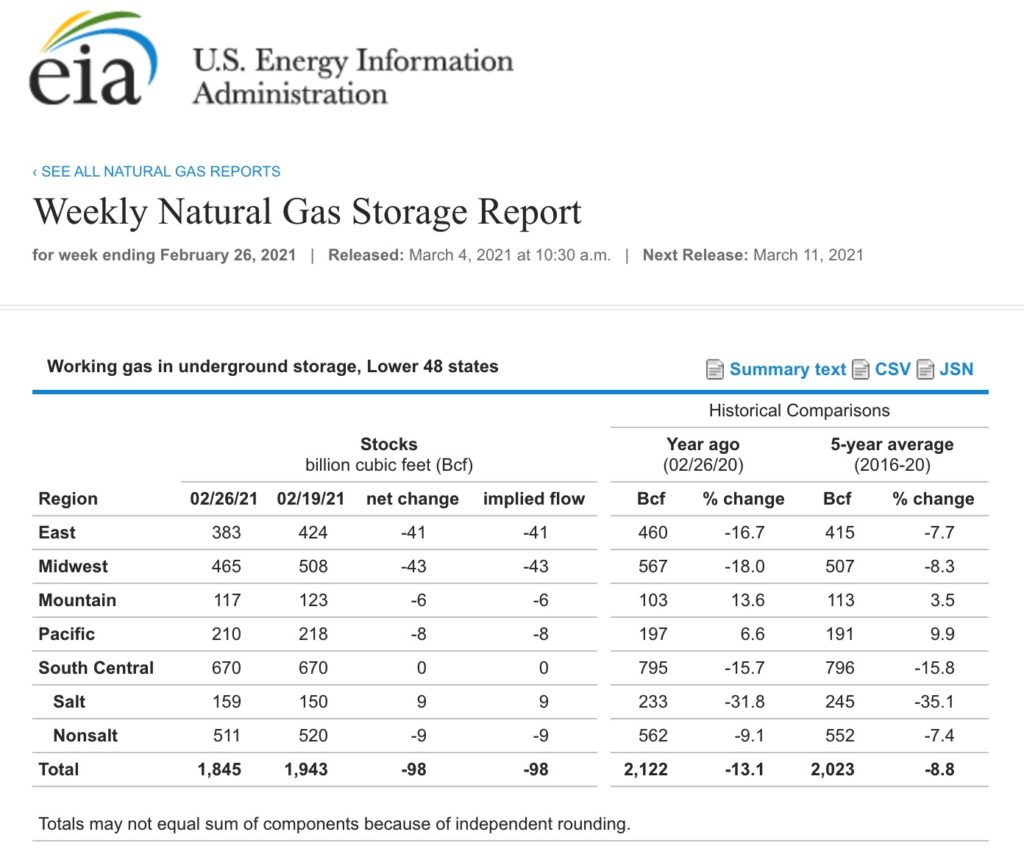
On Thursday, March 4, the Energy Information Administration released the latest snapshot of natural gas inventories across the United States.

While the latest supply data showed a withdrawal from storage below consensus estimates, at 1.845 trillion cubic feet as of February 26, stocks are 13.1% below last year’s level. Moreover, inventories were 8.8% under the five-year average for the end of February.
At the end of the 2020 withdrawal season, stockpiles stood at 1.986 trillion cubic feet, 141 bcf above the latest supplies. Stocks will continue to decline over the coming weeks. According to Estimize, a crowd-sourcing website, the current consensus estimates for the week ending on March 5 is for another 88 bcf decline in inventories.
Bull markets rarely move in a straight line. In the world of commodities, it typically takes a supply shock to cause a parabolic move in the crude oil or natural gas futures market. With more than half the world’s crude oil reserves in the Middle East, a highly turbulent political region, there is always a potential for an unexpected event that sends prices appreciably higher.
The bottom line is the shift in US Energy policy is bullish for oil and gas prices. We are already seeing the impact filter through to prices of the energy commodities. Buying dips in oil and gas could be the optimal approach over the coming weeks and months.
