After gold and silver reached highs in 1980, the prices took a back seat for almost one-quarter of one century when it comes fiat currency instruments. The dollar, euro, yen, and all of the other foreign exchange instruments derive value from the full faith and credit of the governments that print legal tender and mint coins. The rise of currencies and the fall of precious metals reached a crescendo at the end of the last century. At the same time, gold and silver reached their nadir.
London is the hub of the international bullion market. It is ironic that the event that marked the low in the perception of gold as currency came when the United Kingdom liquidated half of its gold reserves. The sale of approximately 300 tons of the metal took the price to a low of around $255 per ounce. In hindsight, the sale was a watershed event.
Gold has long been a currency, and if the yellow metal is the psychological equivalent of banknotes, silver is the change in our pockets. Since the early 2000s, the precious metals have been making a comeback since gold traded to the $250 level and silver to just over $4 per ounce in 2001. The most liquid ETF products in the gold and silver market that hold physical metal are the SPDR® Gold Shares (NYSE:GLD) and the iShares Silver (NYSE:SLV). Between the two, they hold $43.65 billion in the two metals as of Friday, August 9.
Gold rises to the highest price since 2013
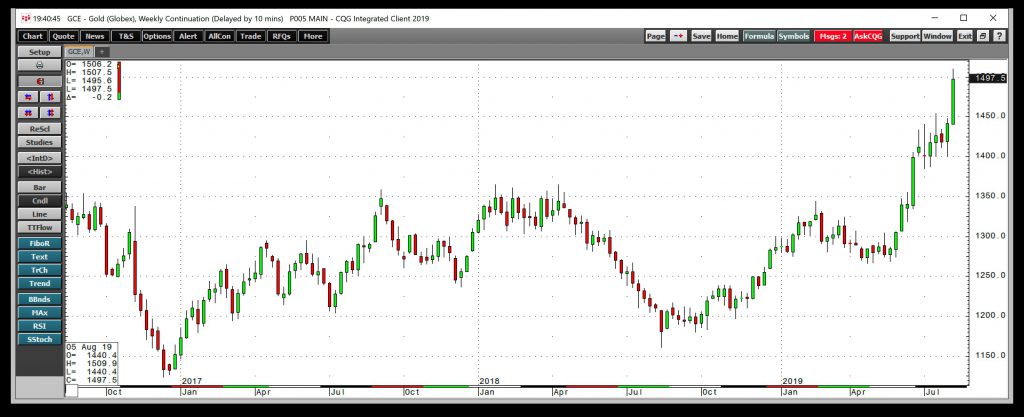
Last week, gold made another in a series of new highs since the price broke out above the level of critical technical resistance at $1377.50 per ounce. The week of August 5 was a wild time in markets across all asset classes. Stocks moved lower and then recovered. China devalued the yuan, which fell to seven to one against the US dollar. The US made the symbolic move of designating China as a currency manipulator. Gold followed through on the upside after putting in a bullish reversal on the weekly chart the previous week.

The weekly chart shows that the yellow metal rose to a high at $1509.90 per ounce, the highest price since April 2013. The price settled last Friday at just under the $1500 level. The yellow metal has been on fire.
Silver trades north of $17 per ounce

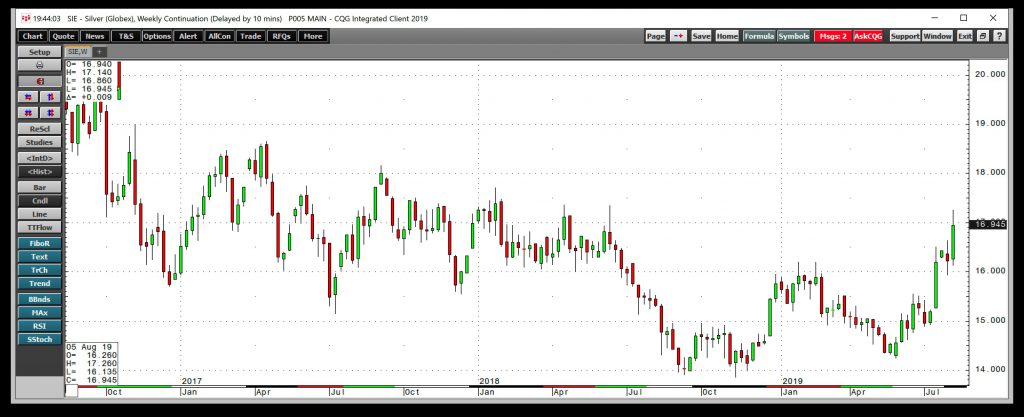
During the week of July 15, silver reached a milestone when it rose to a new high for 2019. While the metal has not come close to its 2016 high, it broke a bearish pattern of lower highs and lower lows that had been in place since the year that the price traded at just over the $21 per ounce level.
The weekly chart shows that after stalling at over the $16 level, silver extended its gains and surpassed $17, reaching a high at $17.26 last week. Silver settled on Friday, August 9 at just under $17, but the price has not given back much of the gains since taking off on the upside from $14.245 in late May.
The bullish price action in the gold and silver markets continued last week, and the trends in both metals remain higher.
A pullback is possible, but the trend is your friend
Markets rarely move in a straight line. Gold and silver experienced more than a few failures after reaching highs in July 2016, but that period appears to be over. However, the odds of price corrections will continue to increase with prices over the coming weeks and months. In the world of precious metals, bull markets can be like riding a psychotic horse through a burning barn. As weekly price ranges increase, the markets look great when they are rallying and scary during corrective periods. Many market participants find themselves buying highs and selling lows, as greed and fear are powerful emotions. Patience and discipline are often the attributes that separate those who profit during bull market periods from those who wind up with losses.
The trend is a trader’s best friend. Avoiding emotional trading and investing involves taking advantage of other’s emotions tends to lead to optimal returns. Baron Rothschild, an 18th century British nobleman and member of the famous banking family, once said that “the best time to buy is when there’s blood in the streets.” That strategy tends to work from a long-term as well as a short-term perspective.
Gold and silver are making upside progress, and higher prices are likely. Remember to approach the markets with a plan that replaces emotion with discipline and logical approach to risk and reward.
The SPDR Gold Shares (NYSE:GLD) (GLD) was trading at $143.13 per share on Wednesday morning, up $1.35 (+0.95%). Year-to-date, GLD has gained 15.75%, versus a 7.51% rise in the benchmark S&P 500 index during the same period.
GLD (NYSE:GLD) currently has an ETF Daily News SMART Grade of B (Buy), and is ranked #1 of 33 ETFs in the Precious Metals ETFs category.
