Bitcoin traders and enthusiasts are riding the wave after the incredible rally from $9,000 to $42,000 throughout Q4 2020. It certainly was an incredible run—more than quadrupling in value in less than three months. Now we find ourselves in an early 2021 corrective phase which will end in either another Breakout/Rally attempt or an Excess Phase (Blow-off) Top. This article highlights both potential outcomes because at this stage it is difficult to determine a single high-probability outcome.
What A Bitcoin Breakout Would Look Like
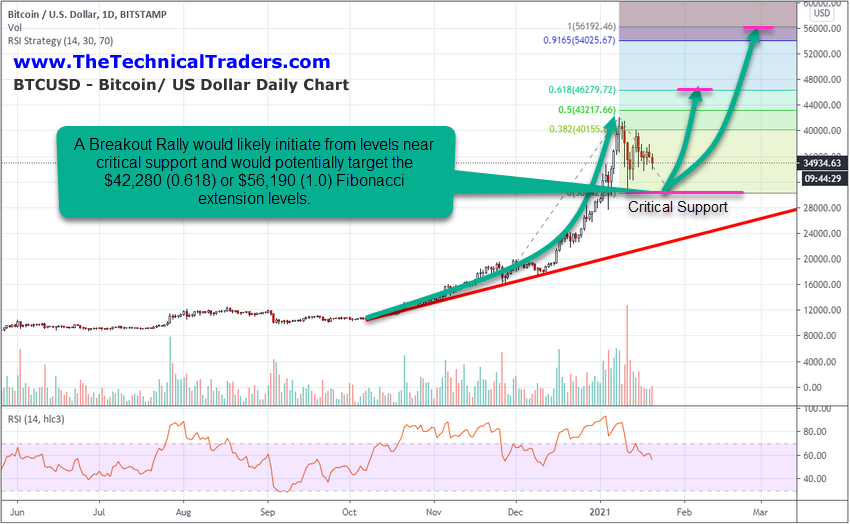
Let’s take a look at what a Breakout/Rally technical setup in Bitcoin would look like in the near future. Looking at the chart below, price must hold above critical support near $27,800 as any new lower low would constitute a continuation of the Bearish downtrend. Therefore, any renewed rally attempt would likely initiate from levels near $28k (or just below this level).
Using a Fibonacci Price Extension, we can see the $42,280 (0.618) and the $56,190 (1.0) Fibonacci Extension levels are key potential upside price targets if a breakout/rally resumes. We are measuring the most recent bottom, in late November, to the current high price level, then aligning the Fibonacci price extension bottom to the current price lows (near $30,260). This allows us to see future potential price target levels if this rally/uptrend continues.

Again, it is critical that the support level near $27,800 holds and price lows do not breach this level. Any breach of this support level would constitute a “new lower low” in Fibonacci Price Theory—which suggests a downtrend is continuing.
What A Bitcoin Breakdown Would Look Like
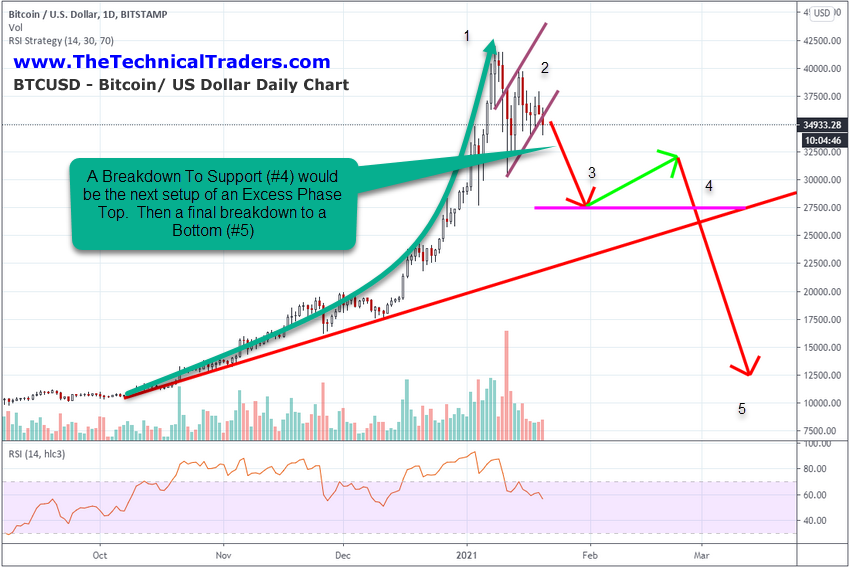
The opposite aspect of this recent peak is that it may be setting up as an Excess Phase (blow-off) Top, as we can see the #1 (extreme rally) and #2 (sideways flag) setup in price recently. The completed Excess Phase pattern consists of five total processes:
- The extreme upside price rally
- The TOP, followed by a moderate downside price trend that sets up the FLAG
- The breakdown of the FLAG trend, which then targets a broader support level
- The breakdown of that support level, which then targets the ultimate bottom/momentum base level
- Once the ultimate bottom/base is established, then a new momentum/bottom begins and trend usually attempts another rally attempt.
Obviously, when you look at the Bitcoin to USD chart (below), it is fairly easy to identify the #1 and #2 setup of the Excess Phase Top. The next question is will price breakdown and attempt to move below the $27,800 recent low support level or will it hold above this level, prompting another rally attempt. If price breaks below the $27,800 support level (near recent lows on January 11, 2021), then we need to be very cautious of the broader Excess Phase Top process continuing and a continued breakdown resulting in lower price trends. If the $27,800 support level holds, as we suggested in the Breakout/Rally example above, then there is a strong chance that $42k to $56k could be the next upside targets.

I understand that readers and traders want to have more clarity on the direction Bitcoin will go, but ultimately, we need price to complete the next phase of this process. It all hinges on the current $27,800 support level right now. As long as that support level holds, then there is a very strong possibility that another upside price rally will begin at some point in the future. If it is broken and the Flag Breakdown continues, then it would appear the Excess Phase Top has moved into Phase #3 and will likely continue to unfold.
