Get 40% Off
⚠ Earnings Alert! Which stocks are poised to surge?
See the stocks on our ProPicks radar. These strategies gained 19.7% year-to-date.
Unlock full list

What Is In Store For Tron?

Published 01/08/2019, 11:17 PM
Updated 07/09/2023, 06:31 AM

TRX/BTC Technical Analysis


The TRX/BTC pair is in the process of completing a saucer bottom, bullish reversal chart pattern. After consolidating for over four months at a key support level, it finally broke above the daily Ichimoku cloud on December 18th and reversed the future cloud to indicate further gains. Since then, the pair has crossed above one key Fibonacci level after another, bringing it to Tuesday’s test of the 50% Fibonacci retracement level which tracks the downtrend that started in May 2018 and bottomed in November.
Tron TRX/BTC Technical Analysis

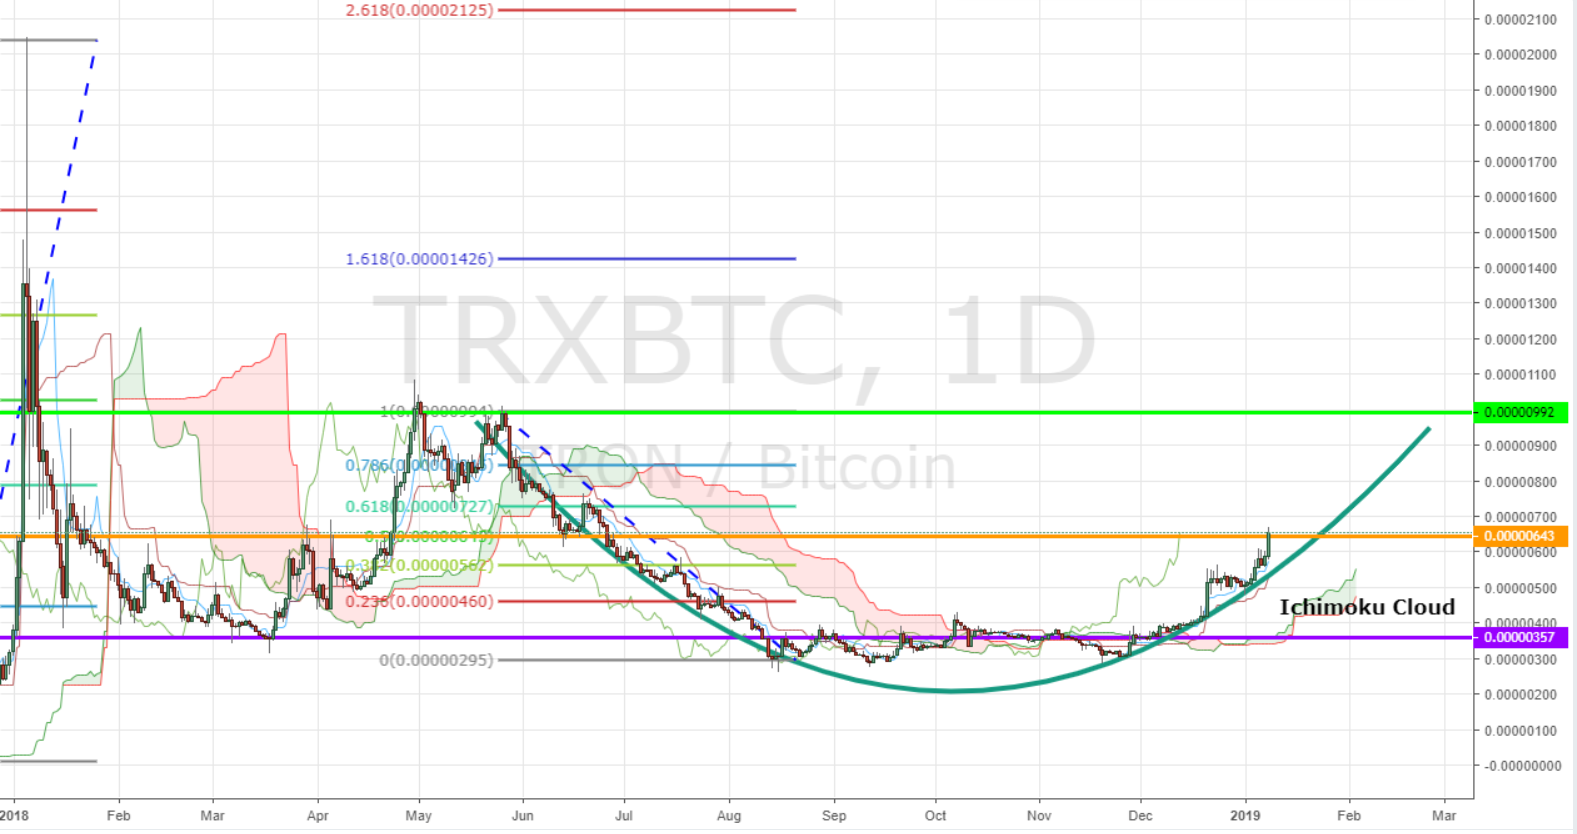
This is a huge milestone as the 50% Fibonacci is generally known to be the toughest to break. With that, we may see a bit of consolidation or even a temporary pullback around this level in the medium term, before TRX price gets back on its uptrend. A temporary pullback could be considered a buying opportunity for those investors who have sufficient risk tolerance to weather the volatile crypto markets. Always remember to only invest the money you can afford to lose.

Latest comments

Risk Disclosure: Trading in financial instruments and/or cryptocurrencies involves high risks including the risk of losing some, or all, of your investment amount, and may not be suitable for all investors. Prices of cryptocurrencies are extremely volatile and may be affected by external factors such as financial, regulatory or political events. Trading on margin increases the financial risks.
Before deciding to trade in financial instrument or cryptocurrencies you should be fully informed of the risks and costs associated with trading the financial markets, carefully consider your investment objectives, level of experience, and risk appetite, and seek professional advice where needed.
Fusion Media would like to remind you that the data contained in this website is not necessarily real-time nor accurate. The data and prices on the website are not necessarily provided by any market or exchange, but may be provided by market makers, and so prices may not be accurate and may differ from the actual price at any given market, meaning prices are indicative and not appropriate for trading purposes. Fusion Media and any provider of the data contained in this website will not accept liability for any loss or damage as a result of your trading, or your reliance on the information contained within this website.
It is prohibited to use, store, reproduce, display, modify, transmit or distribute the data contained in this website without the explicit prior written permission of Fusion Media and/or the data provider. All intellectual property rights are reserved by the providers and/or the exchange providing the data contained in this website.
Fusion Media may be compensated by the advertisers that appear on the website, based on your interaction with the advertisements or advertisers.
© 2007-2024 - Fusion Media Limited. All Rights Reserved.