
Commercial Metals Company (NYSE:CMC) is scheduled to report second-quarter fiscal 2020 results on Mar 19, before the opening bell.
Which Way are the Estimates Headed?
The Zacks Consensus Estimate for fiscal second-quarter revenues stands at $1.41 billion, suggests growth of 0.16% from the prior-year reported figure. The Zacks Consensus Estimate for earnings per share is pegged at 50 cents for the quarter, indicating an improvement of 72.4% from the year-ago quarter.
Fiscal Q1 Performance
In the last reported quarter, the company’s bottom line beat the Zacks Consensus Estimate, while the top line missed the same. However, both earnings and revenues improved year over year. The company surpassed the Zacks Consensus Estimate in three of the trailing four quarters, the average positive surprise being 15.3%.
Crown Holdings, Inc. Price and EPS Surprise
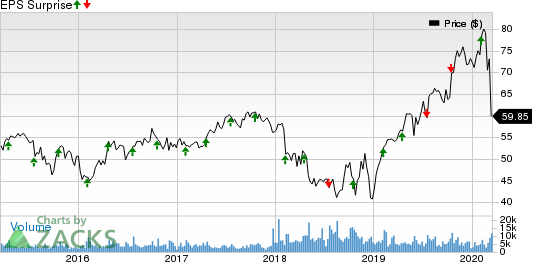
Crown Holdings, Inc. price-eps-surprise | Crown Holdings, Inc. Quote
Key Factors to Consider
Increased spending on construction activity in the United States is likely to have contributed to the company’s fiscal second-quarter performance. Moreover, solid fabrication backlog is likely to have benefited results in the quarter under review. Americas Recycling business is likely to have gained from the recent rebound in ferrous scrap prices. However, the coronavirus outbreak in China impacted demand for steel consumption. The virus is currently a pandemic and has severely impacted Europe in particular. This is likely to have weighed on the fiscal second-quarter performance.
Also, inflationary pressures on manufacturing costs due to a tight labor market, and consumable raw-material prices are expected to have dented the company’s margins in the to-be-reported quarter. Furthermore, its debt-to-equity ratio has gone up to fund the acquisition of certain U.S. rebar steel mill and fabrication assets from Gerdau S.A. Consequently, the company’s margins in the to-be-reported quarter are expected to reflect the negative impact of higher interest expense.
Segment Projections
The Zacks Consensus Estimate for the Americas Recycling segment’s revenues is pegged at $268 million, suggesting a decline of 7% from the year-ago quarter. Ferrous tons shipped during the quarter under review are estimated at 560,000 tons, down 2%. Average ferrous selling price is projected at $228 per ton, down 14% from the prior-year quarter, reflected a challenging price environment. The estimate for non-ferrous shipments is at 60,000 tons up 2% from the prior year. Average non-ferrous selling price is at $2,085 per ton, reflecting a 4% year-over-year growth of 4%. The segment is expected to report adjusted EBITDA of $12.4 million, 22% higher than the prior-year quarter’s figure of $10.1 million.
For the Americas Mills segment revenues, the Zacks Consensus Estimate is pegged at $705 million, reflecting a year-on-year decline of 9% from the prior-year quarter’s $775 million. The segment’s adjusted EBITDA is projected at $120 million, indicating an improvement of 7% from the $12 million reported in the prior-year quarter. Total tons shipped are estimated at 1090 tons, flat from the prior-year quarter. Metal margin is projected at $370, down 1% from the year-ago quarter due to expected declines in both selling price and lower scrap costs.
The Americas Fabrication segment is anticipated to report revenues of $538 million in the quarter to be reported, indicating a 1% rise from the $531 million in second-quarter fiscal 2019. The segment is expected to have shipped around 380,000 tons, down 4% year over year. Total selling price is projected at $986 per short ton, up 17% year over year. The increase in average selling price and declining rebar input costs are likely to have benefited margins in the quarter under review. The segment’s adjusted EBITDA is at $17.7 million against the prior-year quarter’s loss of $49.6 million.
The Zacks Consensus Estimate for the International Mill segment’s revenues is currently pegged at $148 million for the fiscal second quarter, suggesting a decline of 15% from the prior-year quarter. The Zacks Consensus Estimate for the segment’s adjusted EBITDA is $8.1 million for the quarter, indicating a slump of 61% from the year-ago reported figure. Shipments are estimated at 300 tons, down 1% from the last year. Selling price is projected at $464, down 15%. Costs are projected at $250, down 17% from the prior-year quarter. Metal margins are at $214, down 12% from the prior-year quarter.
Earnings Whispers
According to the Zacks model, the combination of a positive Earnings ESP and Zacks Rank #1 (Strong Buy), 2 (Buy) or 3 (Hold) increases the odds of a positive earnings surprise.
You can uncover the best stocks to buy or sell before they’re reported with our Earnings ESP Filter.
Earnings ESP: The Earnings ESP for Commercial Metals is +4.98%.
Zacks Rank: The company currently carries a Zacks Rank #2.
Price Performance
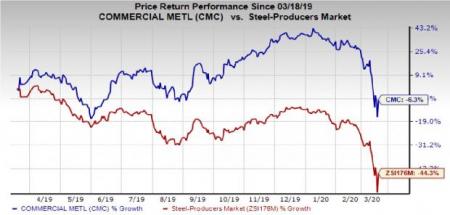
Commercial Metal’s shares have fallen 6.3% in the past year, compared with the industry’s decline of 44.3%.
Stocks Worth a Look
Here are some other Basic Materials stocks which you may want to consider, as our model shows that these too have the right combination of elements to post an earnings beat in their upcoming releases:
Arch Coal Inc. (NYSE:ARCH) has an Earnings ESP of +342.55% and a Zacks Rank #3, currently. You can see the complete list of today’s Zacks #1 Rank stocks here.
Axalta Coating Systems Ltd. (NYSE:AXTA) has an Earnings ESP of +1.14% and a Zacks Rank of 3, at present.
Methanex Corporation (NASDAQ:MEOH) has an Earnings ESP of +30.44% and a Zacks Rank #3, currently.
Today's Best Stocks from Zacks
Would you like to see the updated picks from our best market-beating strategies? From 2017 through 2019, while the S&P 500 gained and impressive +53.6%, five of our strategies returned +65.8%, +97.1%, +118.0%, +175.7% and even +186.7%.
This outperformance has not just been a recent phenomenon. From 2000 – 2019, while the S&P averaged +6.0% per year, our top strategies averaged up to +54.7% per year.
See their latest picks free >>
Commercial Metals Company (CMC): Free Stock Analysis Report
Methanex Corporation (MEOH): Free Stock Analysis Report
Axalta Coating Systems Ltd. (AXTA): Free Stock Analysis Report
Arch Coal Inc. (ARCH): Free Stock Analysis Report
Original post
Zacks Investment Research