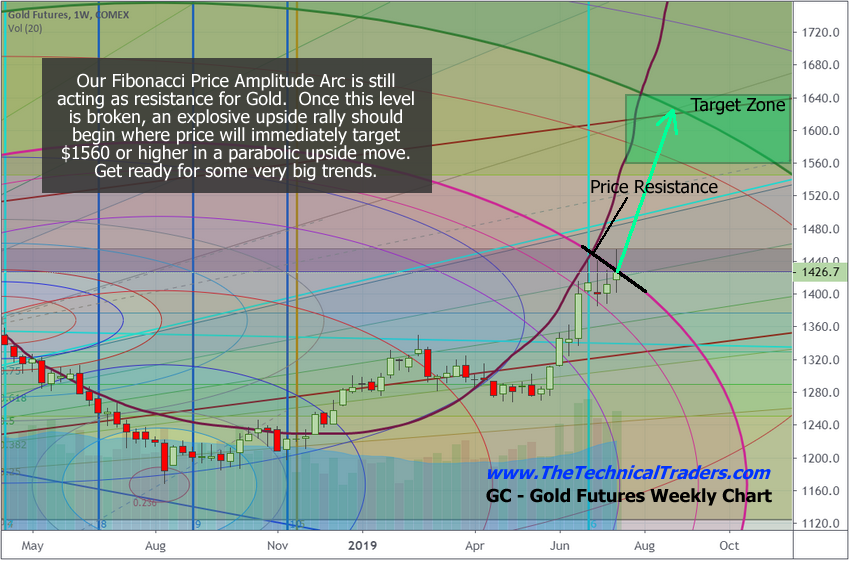
You may remember when we were calling for Gold to rally from $1200 to just above $1300 earlier this year? We warned that once this move completed, a pause and pullback back below $1300 would set up a "Momentum Base" near April 21 that would become the launchpad for a much bigger move to the upside. Now that we’ve seen this setup complete almost exactly as we predicted months in advance, we are waiting for the price to breach the Fibonacci Price Amplitude Arc that is currently acting as resistance for Gold (see the chart below).
Once this level is broken, we believe Gold will rally to levels near or above $1560 and attempt to set up another “Momentum Base” somewhere between $1560 and $1640. This price level represents a key price zone where multiple price inflection points align and where a larger Fibonacci Price Amplitude Arc exists. It is very likely that price will run into resistance near this zone – although it may become very brief price resistance.

Let’s assume that Gold could target various upside price levels in the near future and that Gold may attempt to reach levels just below $2000 before the end of this year (2019). We’ve broken our research into price segments that will help us understand and breakdown Gold price advancement levels for future reference. We’ve selected : $1650, 1750, 1850 & 1950 price levels for our research.
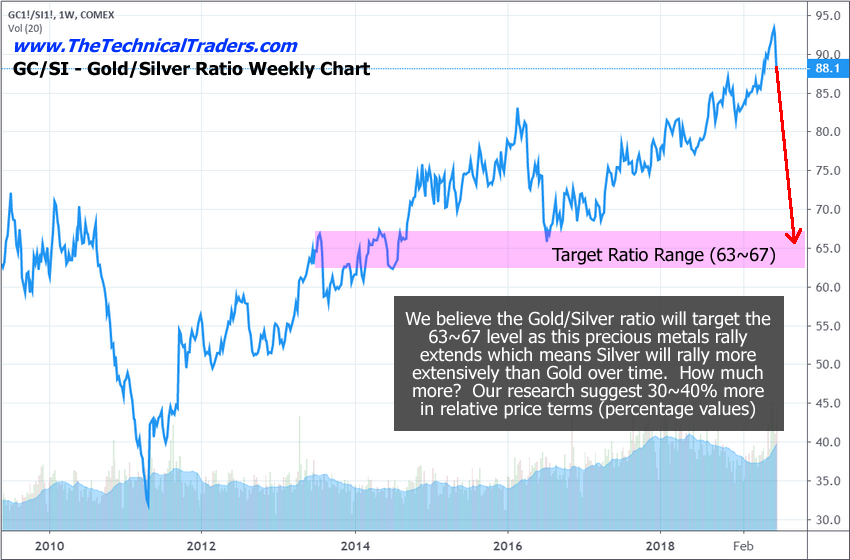
The Gold/Silver ratio chart, below, highlights the incredible rotation we’ve recently witnessed as Silver exploded higher last week. Gold followed this move higher roughly 24 hours later. The ratio between the price of Gold vs. Silver was at historical highs near 93 just a few days ago. Currently, it is at 88.1 – after Silver rallied to help close the price gap between the two metals. As you can also see from this chart, historical normal price levels are much closer to the 45 to 65 range.
What happens when this Gold/Silver ratio value becomes extended is that Gold holds more value than Silver. Silver is a precious metal that is often overlooked because Gold is the primary focus of metals traders. Yet, when a panic hits the global stock markets and Gold begins to move dramatically higher, Silver becomes an incredible opportunity as traders pile into Silver expecting it to close the price ratio gap quickly.
How big is this price disparity between Silver and Gold? How much more will Silver potentially rally if Gold hits certain key upside price targets?

Concluding Thoughts
Using special reference points, the current ratio level, and our expected ratio level, we can determine that for every drop of 5.0 points in the ratio level, the price of Silver should increase by 6.5% to 7.5% to the price of Gold. Therefore, if Gold trades higher to $1500 and the ratio drops from 88 to 83, Silver should be trading at a level of $18.29.
We determined this ratio relationship process by identifying “anchor points” within the historic ratio chart, mapping out price levels that occur at these levels in advancing and declining metals markets, then mapping the corresponding ratio relationships so we could attempt to make these types of predictions.
