
The end of 2018 brought an incredible price rotation in the U.S. stock market. It is time for traders to take stock of the incredible opportunities that are set up for early 2019 and beyond. Our research team put together longer-term Adaptive Dynamic Learning (ADL) predictive price modeling system charts to help you understand and identify opportunities that should play out in early 2019.
Crude Oil
This monthly chart of crude oil showing our ADL price modeling system is clearly indicating the first few months of 2019 will include increased price volatility. One thing to pay attention to as we review these charts are the BLUE TRIANGLES, which is where we asked the ADL predictive modeling system for a detailed analysis, and the CYAN, YELLOW, and WHITE DASHED LINES, which is where the ADL system is showing us the highest probability price outcome into the future. On this chart, we can see that the predicted price levels of the past have been relatively close to where the price has closed on each monthly price bar. Going into the future, we can see 3~4 months of price volatility roughly between $50 and $65 with rotating higher/lower price objectives. We interpret this as greatly increased price volatility with the potential of supply events disrupting global expectations in oil. These could be intermediate-term price rotations that keep the price within our $50~65 price range, or they could be large range, very dramatic price rotations as a result of massive global supply events.
What we can suggest to you, today, is that early 2019 should provide some very interesting short to intermediate term price triggers in oil before price settles back below $50 near June or July 2019.

Financials/Banks
Next, the Financials/Banks appear to be setting up a very deep “price anomaly” pattern that could become one of the biggest price reversals of early 2019. It is not very often that a 90%+ price move sets up in the markets and this could be just such an event. The ADL predictive price modeling system identifies the highest probability price outcomes by mapping and tracking price and technical setups. You can see from this chart we are asking the ADL modeling system to show us what to expect from the February 2018 price bar. This price bar is critical because it was a wide range price rotation setup that should be very unique in the ADL DNA mapping. This bar only had 5 similar DNA markers and projected some of the predicted price level, the ones drawn in WHITE, as 50/50 outcomes. The last few outcomes, drawn in YELLOW, reported as 100% probabilities for these predicted target price levels. Therefore, we consider this a very high probability outcome of a very deep “price anomaly” setup that should result in some incredible upside opportunities for skilled traders.
Additionally, if this analysis is correct, the U.S. stock market may, very quickly, rally to attempt to establish new all-time highs again in early 2019. This move could happen well before May or June 2019. Be prepared for this move because, currently, there are a bunch of shorts that are predicting a 1929 style market crash. Those shorts are going to get crushed in a massive short squeeze if our ADL predictive modeling results are accurate.

SPDR S&P 500
Next, we’ll review the SPDR S&P 500 (NYSE:SPY) monthly chart. And, as you can likely see, this chart is similar to the Direxion Daily Financial Bull 3X Shares FAS chart above with a very deep price anomaly setup. In fact, you are going to see a few of these types of price anomaly trigger setups in this research post because the very deep downside price move, recently, has prompted these types of price triggers. One thing to consider about price rotation and the recent downside price move is that these types of price swings are very healthy for the overall markets. They act as a method of reconfirming value, support and future expectations by devaluing/deleveraging over-extended price levels and shaking up the markets. We think of these types of moves as a “healthy price rotation” that allows the markets to re-establish value and future expectations vs. a type of crisis event.
In addition to this being a very healthy price rotation, we also believe, fundamentally, very little has changed in the past 4+ months in regards to global market events. Europe and China/Asia are still working through their own issues. Credit cycles and global market valuations have been decreasing since early 2018. Overall, the global markets have decreased in value by over 27% since January 2018. What many traders have failed to understand is that the U.S. markets broke lower on a reaction to the U.S. Fed’s recent rate raises while the rest of the global markets had already experienced a 24% valuation decline. In other words, the U.S. markets broke lower in “capitulation” of expectations that the U.S. Fed may have pushed rates beyond expected boundaries. Now that the U.S. markets have revalued near these recent lows and 2019 is about to start, new expectations are settling into traders minds regarding the current market values and future expectations.
Back to our ADL chart of the SPY, you can see the predicted levels of the ADL system matching with price bars fairly accurately. The current bar, the big red one, is reported as a “neutral probability” (WHITE) target price level which means the ADL system could not determine any viable probability for this price target. The following YELLOW price targets range from 57% probability to 94% probability going out 8+ months. Our interpretation of this is that the current price bar, being a neutral price target near $279.60 reports as a “basis price” in the range of previous price rotation. We believe this level, $279.60, will quickly be recovered in early 2019 before a continued rally pushes prices above $300 sometime near April or May 2019.

Transportation Index
Next, one of our favorite charts to gauge the markets and the future expectations of market sectors, the Dow Jones Transportation Index. And, again, you can see a similar price anomaly setup on this chart. The one thing that is very interesting on this chart is that the current price target level for the December 2018 bar has a relatively high ADL probability (68.373%) and the next targeted price level (Jan 2019, near 11,210) has a very high 88.25% probability. It is our opinion that the Transportation Index will rocket higher in early 2019 and reach levels above 10,800 before the end of March 2019 (possibly much earlier). The ADL predictive modeling system is suggesting that the Transportation Index will stay near 11,500 for much of 2019 and we believe the U.S. stock market and major indexes will reach new all-time highs near the start of Q2 2019 and continue to push a bit higher through the middle of 2019. It is very likely that the U.S. market continues to outperform many other global markets throughout much of 2019 and beyond. We’ve read many expectations that the U.S. markets may fall into some level of “complacency” in 2019, but we are not seeing that in our research. We are seeing the U.S. markets continue to report pricing strength in comparison to other global markets and we believe the U.S. economy will continue to stay strong throughout at least the first 2~3 quarters of 2019 – possibly much longer.
Again, this incredible opportunity for skilled traders is showing a potential +23% upside rally that should start in early 2019. Be prepared for some great trades in 2019.

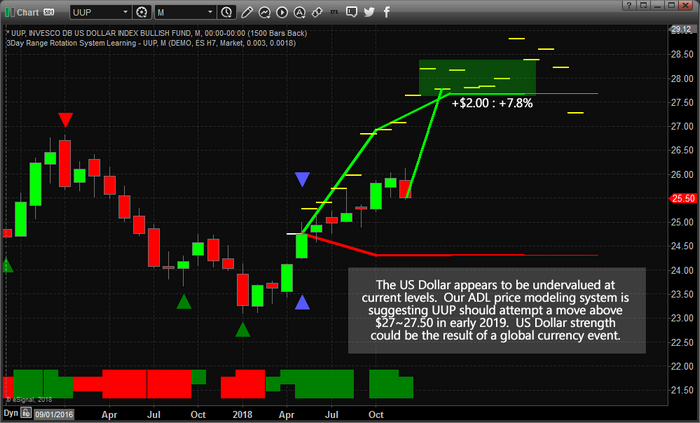
U.S. dollar
Lastly, the U.S. dollar. With so many people expecting the U.S. markets to push lower in 2019 and the resulting pressures on the U.S. dollar (as some analysts expect the yuan to strengthen while the U.S. dollar weakens), our ADL predictive modeling systems is suggesting that the U.S. dollar is currently undervalued by nearly 8%. The early 2019 ADL price targets are near or above $27.50 with the current price being near $25.50. This represents a 7.8% to 8.3% upside price anomaly if our ADL predictive price targets are accurate. This ADL trigger bar, where the BLUE TRIANGLES are on this chart, was a fairly rare price/technical pattern, or DNA marker. It is predicting a 100% probability of these price levels being accurate based on this rare DNA marker. We interpret that outcome as a breakout above $26 in UUP would help to confirm this ADL analysis and the potential that $27.50 to $28.00 is a viable longer-term price objective.
Overall, we don’t see any reason to be bearish the U.S. dollar at the moment. Our ADL predictive modeling system is suggesting the U.S. dollar is currently undervalued by about 8% and is predicting early 2019 upside potential which indicates the potential for greater global currency volatility in the euro, the yuan, and other widely held currencies. If out ADL predictive pricing levels are accurate, it would indicate that we are going to see global currency pricing pressures hit many global currencies fairly early in 2019. Possibly, this could be related to some geopolitical event or some type of isolated credit market event (Italy, Spain, EU, China, Asia). Again, we don’t know what the event will be, but we can assure you that our ADL predictive modeling system is suggesting the U.S. dollar will increase in value by about 8% in early 2019.
These incredible setups and opportunities for skilled traders can only be found with our proprietary Adaptive Dynamic Learning (ADL) predictive modeling tool. Call it a New Year’s gift or whatever you want to call it. Within this research article, we’ve shown you what we believe are some of the most incredible trading setups to start 2019 and we’re confident in our model’s ability to accurately find and call these moves.