While silver investment demand is totally off the radar, certain indicators, including the Gold-Silver ratio, suggest that interest in the poor man’s gold will likely increase significantly over the next few years. The rising interest in silver will also occur as the broader markets continue to meltdown towards more realistic valuations.
In my recent youtube video, Amazing Silver Setup & Stock Market Update, I had a few comments stating the selloff of silver and rise in the stock market suggested that my analysis was incorrect. I find this sort of short-term thinking quite interesting when I noted that the information in the video was presented to occur over the next 1-2 years. Furthermore, in looking at my Youtube analytics of that video, the average watch time was about 10 minutes. The video was 24 minutes long.
Unfortunately, the attention span of individuals today isn’t what it used to be. So, even though the material is presented in detail, many people don’t even take the time to either read or watch it in its entirety. Moreover, when someone replies that the silver price selling off since the video was produced doesn’t understand that markets trade over a LONG PERIOD OF TIME. Anyone who is concerned with the silver or gold price on a daily basis (not including professional traders), needs to realize that TRENDS TAKE TIME.
Also, the naysayers that claim the precious metals analysts have been wrong since 2012 tend to overlook the massive money printing, the enormous increase in debt and the continued disintegration of the global oil industry. If I am not getting my point across, let me provide the following chart that shows just how quickly things can fall apart when investors have been BAMBOOZLED by the Fed and Wall Street:
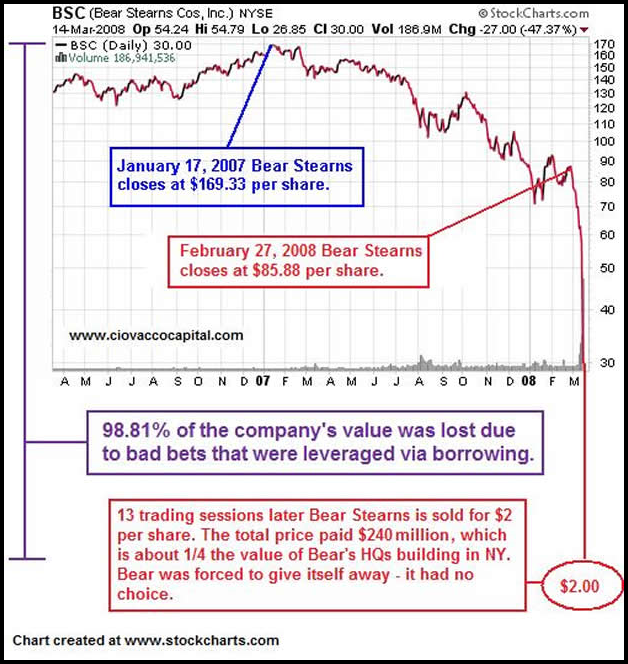
How did Bear Stearns go from nearly $90 a share down to $2 in a relatively short period? How did the market not realize the big problems at Bear Stearns had taken place years prior to its selloff?? The market was oblivious due to the type of rubbish put out by Wall Street analyst CNBC’s Jim Cramer on March 8th, 2008 stating the following:
Tuesday, March 11, 2008, On Mad Money
Dear Jim: “Should I be worried about Bear Stearns in terms of liquidity and get my money out of there?” – Peter
Jim Cramer: “No! No! No! Bear Stearns is fine. Do not take your money out. Bear Sterns is not in trouble. If anything, they’re more likely to be taken over. Don’t move your money from Bear. That’s just being silly. Don’t be silly.”
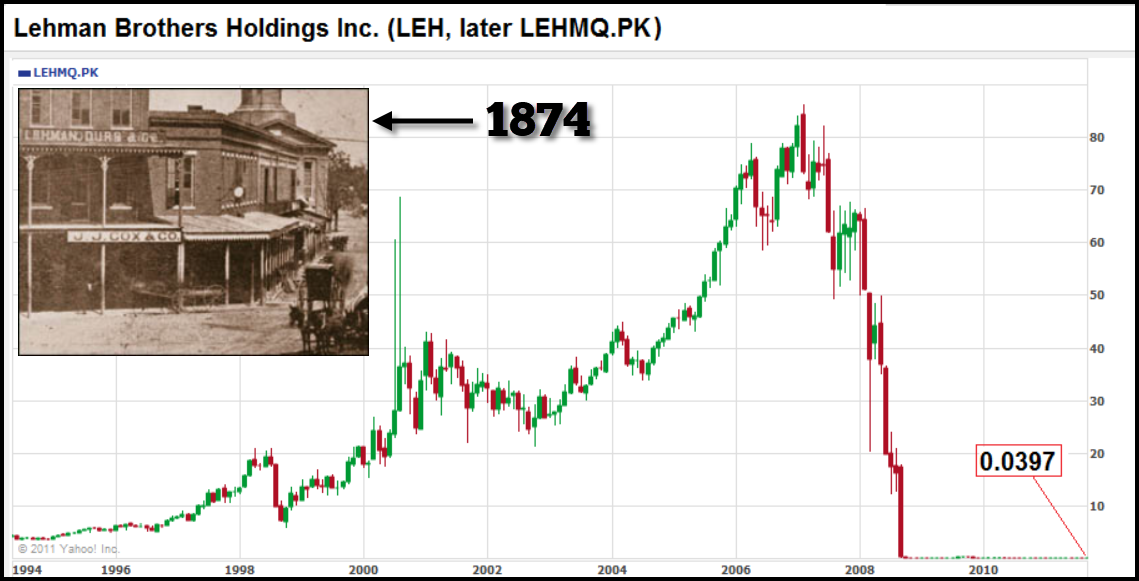
Well, by March 14th, 2008 liquidity and financial conditions deteriorated rapidly at Bear Stearns. We also must remember, that Lehman Brothers, an investment bank that had started right after the Civil War, also collapsed and went bankrupt in a very short period of time:
You see, underneath the Wall Street veneer was a heaping pile of garbage being masqueraded as quality companies and stocks. Today, we have the same problem, but orders of magnitude worse. Unfortunately, investors don’t realize that the volatile trading taking place on the Dow Jones Index is WARNING SIGN for much lower prices to come:
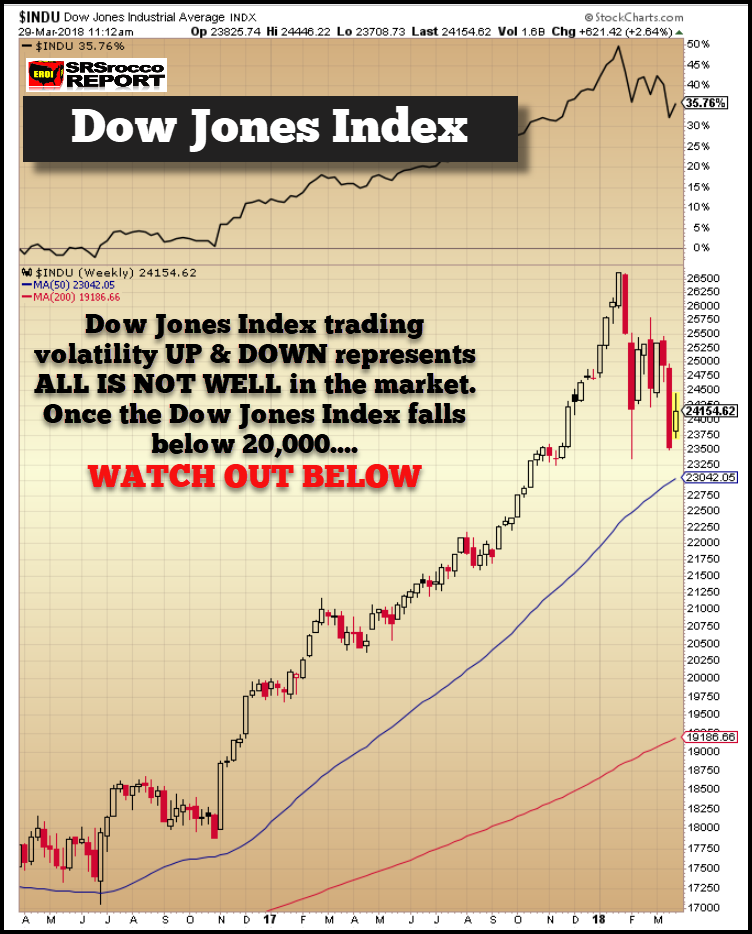
When the Dow Jones Index is trading up and down by 1,000+ points a week, it is setting up for a BIG MOVE LOWER. As I have mentioned over and over, nothing goes down in a straight line, and it will likely take 1-2 years for the Dow Jones Index to bottom well under the 10,000 level. So, we will probably see the index continue to rotate up and down from its high of 26,600 in January.
However, all bubbles pop. And when this market pops, one asset that is most certainly undervalued or is totally off the radar is silver. If we look at the Gold-Silver Ratio long-term chart, we can see a very interested trading range:
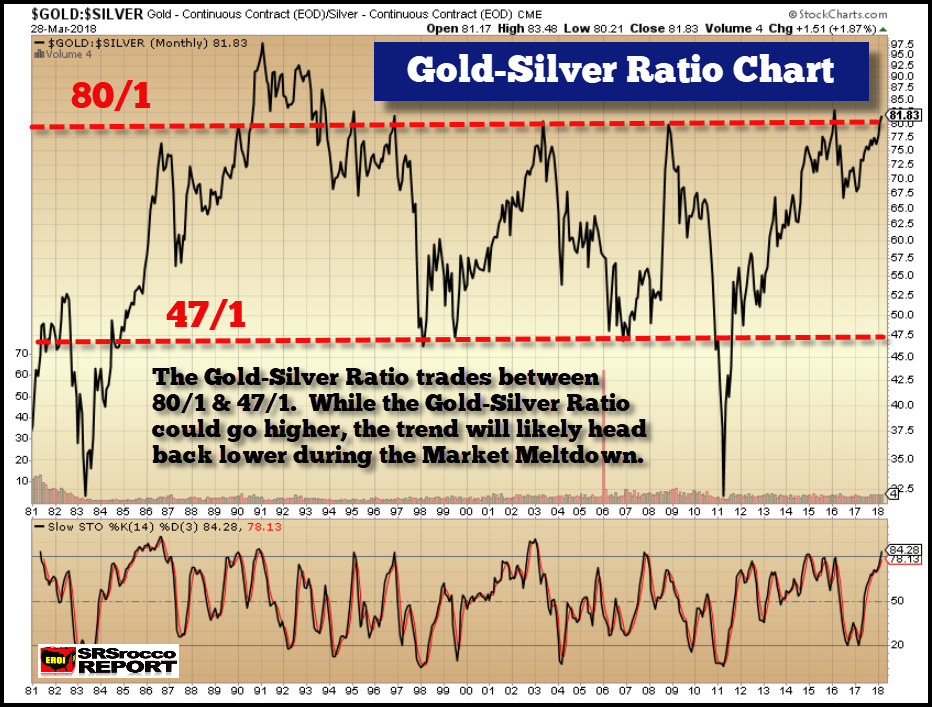
For the past 20 years, the Gold-Silver ratio has been trading in a range of 80/1 and 47/1. Currently, the Gold-Silver ratio is in the higher range of 81/1. Of course, the Gold-Silver ratio could rise even higher, but when we include that the current breakeven price for the primary silver mining industry is about $15-$16 and the record low Commercial Net Short position of 3,700 contracts, a level I haven’t seen for years, then it provides clear evidence that the silver market is now getting at an extreme level looking for a reversal.
Here is the recent COT Report for Silver:
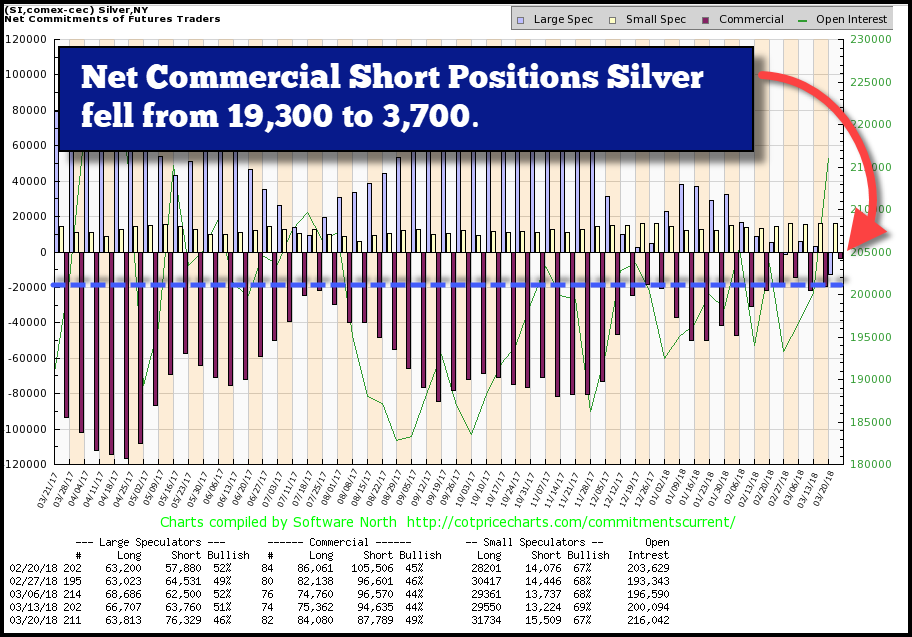
As we can clearly see, the Commercial Net Short Position (Red Bars) is well below its low of 20,000 contracts. Furthermore, the Large Speculators (Light Blue Bars) are now short silver by 12,000 contracts. The last large spike in Spec short positions was back in 1997:
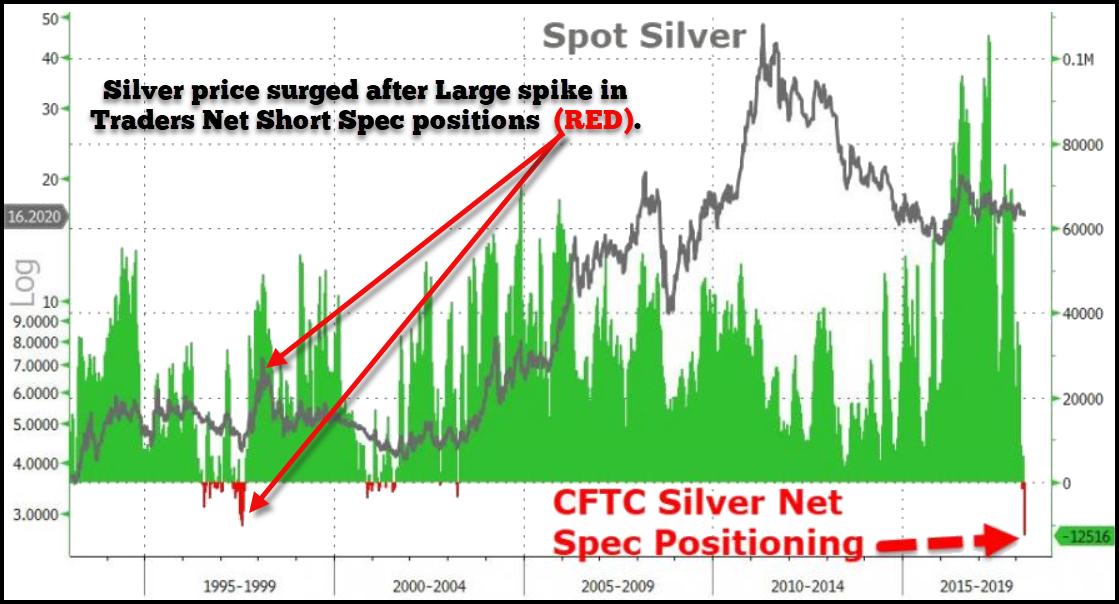
Soon after the large spike in Spec Shorts, the price of silver surged. Even if we look at the smaller Spec short positions in the 2000-2004 period, we can also see a move higher in the silver price after each small spike lower in the Spec shorts.
By looking at these indicators, we must understand that it is difficult to gauge the value of silver on a daily basis. Rather, I look at the changing trend and what will happen to the silver price in the future… over the next few years.
If we assume that the massive leverage, debt and trading margin are going to cause the stock market to fall more than 50% over the next 1-2 years, so will Real Estate prices. However, it may take longer for Real Estate values to lose 50%, but this time around home values may not rebound. So, it is imperative that investors change their strategy from trying to BUILD WEALTH, to PROTECTING WEALTH.
Lastly, here is the most recent chart from the information provided by the Savills World Research on Global Mainstream Asset Universe:
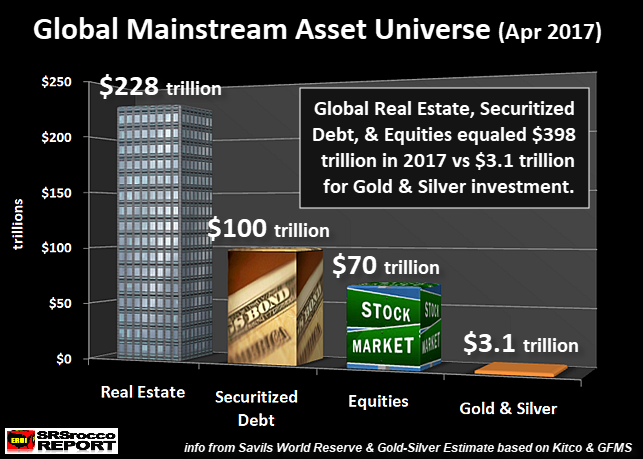
As of April 2017, the current Global Asset values of Real Estate, Securitized Debt, and Equities equaled $398 trillion versus $3.1 trillion in total Gold and Silver Investment. As investors throughout the world start to realize they are holding onto assets they will continue to lose value over the next 2, 5 and 10 years; the smart, prudent and wise investor will move into gold and silver to protect wealth. If only 1% of these assets ($4 trillion) move into gold and silver… we could see some pretty insane values.
In conclusion, STOP LOOKING AT DAILY MOVES in the markets and precious metals. That is nothing more than white noise. However, it is important to understand the disintegrating dynamics in the oil industry as well as the changing indicators mentioned in this article. Most precious metals analysts do not understand the negative ENERGY DYNAMICS, so a group has moved in the Crypto Market. I have provided many articles stating that the cryptos were in a massive bubble.
Today we see more carnage in the Crypto Market as Bitcoin is down more than 11%, Ethereum down 13% and Litecoin down more than 13%. I will be putting out a new video on the FRAGILE NATURE OF CURRENCIES, and I highly recommend you checking it out.
