Since the 1993 publication by Eugene Fama and Kenneth French of their landmark paper “Common risk Factors in the returns on stock and bonds,” the small-cap effect has been seen as one of the pillars of factor-based investing — at least as far as the academic/quant community has been concerned. For investors more interested in making money than publishing papers, however, those pillars have been shaky at best. So what’s the deal? Will the little guys eventually roar back to life, or should investors and money managers consider defunding the small-cap equities and ETFs?
What Exactly Is The Small-Cap Effect
In terms of financial theory and logic, it doesn’t and never did exist. Stocks are valued with respect to the present value of expected cash flows (however one wants to articulate that mathematically), and none of this bears any relationship to the size of the company or the market capitalization of its stock.
Fama-French made a big deal about size because statistical studies they conducted on past stock price behavior showed them that during the time periods they examined, small-caps performed better than large caps. Had the study been done at a time when large-caps outperformed, they and their follower's investors would have been talking about a large-cap effect.
Therein lies the problem. When we study what was (based on historic data) without reference to what should be (based on financial theory and logic), we can wind up with odd and unstable conclusions.
The Changing Fortunes Of Small-Cap
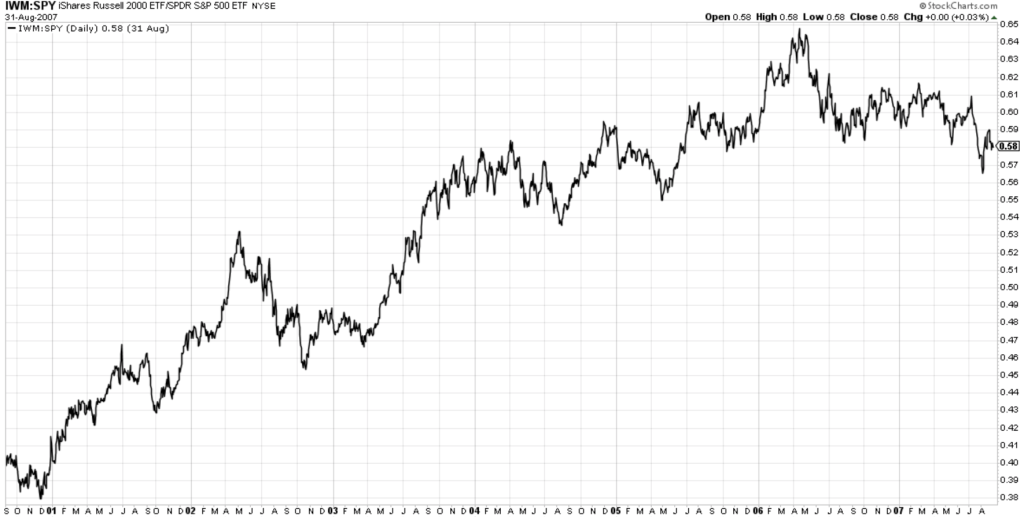
As late as 2000 and subsequent years — as automation and quant modeling were catching on in a big way, it looked like the small-cap effect publicized seven-years earlier was very much for real.
Figure 1 – Ratio of small-cap-oriented iShares Russell 2000 ETF (IWM) to the large-cap-oriented SPDR S&P 500 ETF (NYSE:SPY), Early Years

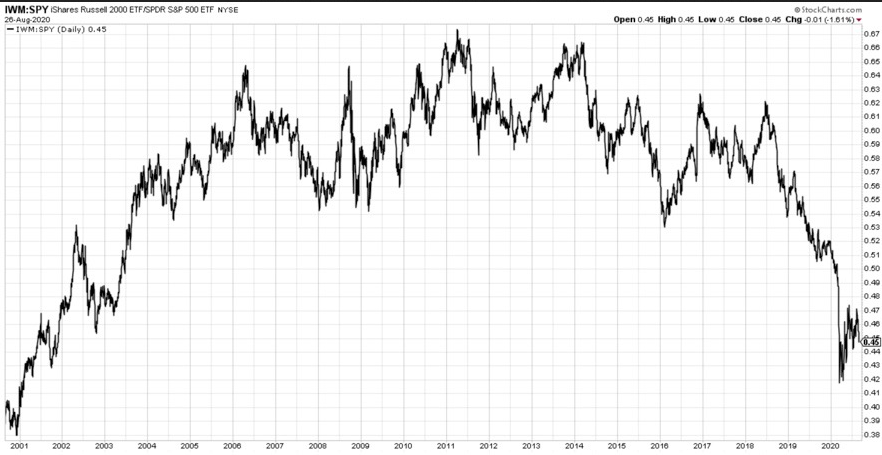
But ultimately, that notion came into question as the tide of the market turned and stocks behaved differently than they did during the periods Fama-French studied.
Figure 2 – Ratio of IWM to SPY, The Long View

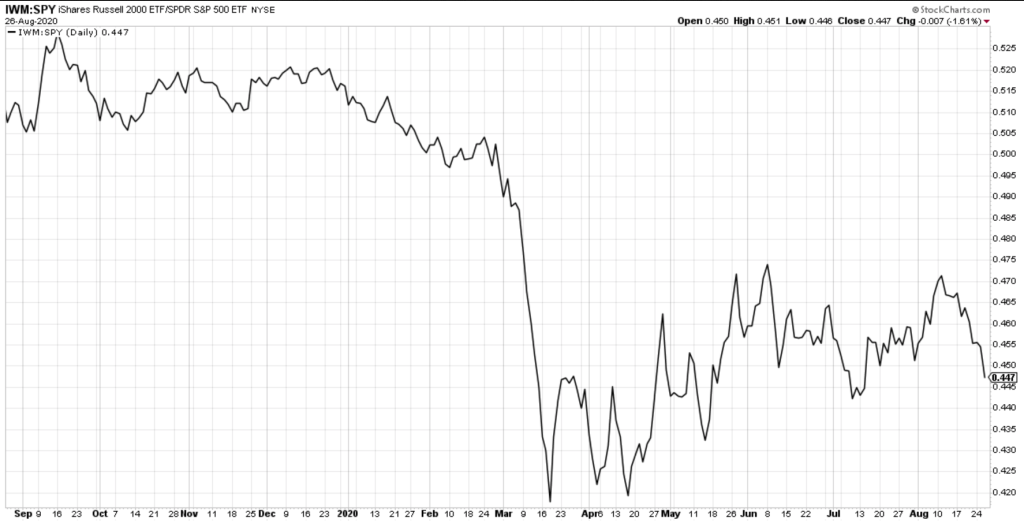
Figure 3 provides a close-up of the recent past. Much of it was terrible for small-capitalization stocks. But lately, it looks as if the little guys are pounding hard against the door that had been keeping them trapped in the basement.
Figure 3 – Ratio of IWM to SPY, The Recent View

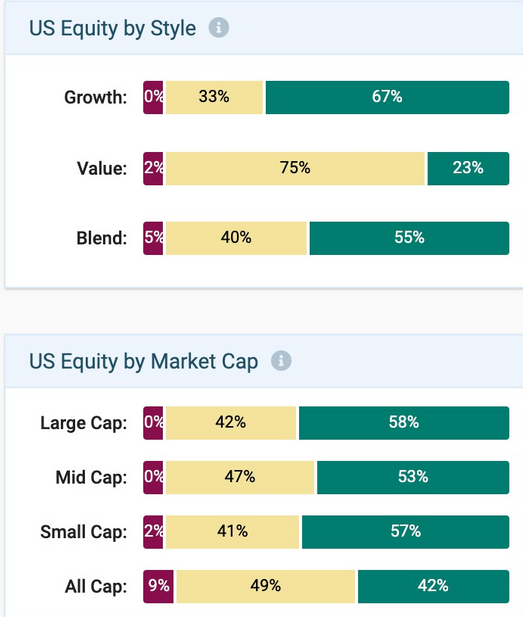
Figure 4, showing a portion of the PortfolioWise dashboard, provides additional support for the notion that small cap is trying to break out of the darkness. The graphs show the proportion of US equity ETFs in a particular category that rate Bullish, Neutral or Bearish under the Portfolio Wise ETF Power Rank model based on technical considerations and fundamental characteristics of stocks held in ETF portfolios.
Figure 4 – What’s Favored, What’s Not Among US Equity ETFs

I get that small cap ETFs are not being shown in Figure 4 as world beaters. But they are looking far better now than had been the case since PortfolioWise, and this dashboard, were launched early this year; during much of that time, large-cap held a solid lead.
Large Versus Small- A Business-Focused Vantage Point
Let’s put aside the statistics and math and look instead through the eyes an equity investor studying companies.
There is a noticeable structural difference between small and large and it would exist even if we don’t calculate market capitalization. It’s about the companies themselves; about the way size and scale are inextricably intertwined with things about which investors care very deeply.
One consideration is the role of fixed costs; economies/diseconomies of scale. This relates to a branch of accounting that, unfortunately, exists completely apart from anything used by investors. I’m referring to cost accounting and its focus on fixed versus variable costs and its emphasis on contribution margin, which measures the relationship between revenues, fixed costs and variable costs.
Economies of scale occur when revenue dwarfs fixed costs. For small companies, the reverse is more likely to be true. When fixed costs (these do not vary as companies become larger or smaller) are large relative to total costs, smaller changes in revenue have larger impacts on bottom-line changes. That means there’s a built-in presumption that profit streams for small companies will be more volatile, all being equal, than is case for big firms. More volatile earnings (E) often spell more volatile market expectations (P/E), thuss leading to more volatile stock prices (Beta). And needless to say, the larger the fixed-cost base relative to total cost, the more likely the company is to experience an existential crisis when business conditions sour. In good times, this “operating leverage” works the opposite way and magnifies potential share-price gains. (Actually, few kinds of costs are completely fixed. Most are stepped; i.e., they are fixed within a certain range of sizes, they jump up to another steady level at the next range sizes and so on. But the fixed-versus-variable remains a valuable framework.)
The other consideration is the business portfolio. Many small firms are analogous to an investor with just one stock in a portfolio; no diversification, nothing there to mitigate the risk of that business falling in hard times. For large firms operating in a single industry, there’s still likely to be much more business diversification than you’ll see in a small single-industry company. This can easily be seen by reading 10-K business descriptions and noticing how what looks like a one-business large company actually is very well diversified in terms of market segment, product type, customer type, regional exposure and so forth (like the difference between a single technology stock versus a portfolio containing a variety of tech stocks). Concentration risk spells more volatile revenue streams — and we saw above how high fixed cost structures magnify the impact of revenue change on earnings and stock prices.
Supporting Evidence
To compare small and large-cap respectively, we’ll analyze constituents of the IWM and SPY ETFs. There is no perfect way to compare two groups. Median and Average both have pros and cons. Median is a less information-rich statistic than average. But the average is more prone to oddball outcomes due to extreme observations. Average and mean are both used here, since ultimately, they both point to the same conclusions.
Table 1 compares annual sales volatility over the last five years; specifically, the ratio of the 5-year standard deviation of sales to the 5-year average.
Table 1

We see that sales have, in fact, been more volatile among small-capitalization companies.
We can’t get directly at fixed and variable costs since they are not among the numbers publicly reported. But we can approximate. Both “cost of goods sold” (COGS) and “selling, general and administrative expenses” (SGA) contain fixed and variable elements. On the whole, though, I think it’s reasonable to assume COGS is largely variable and that SGA is largely fixed. And for all practical purposes, interest expense is fixed.
Table 2 shows SGA and Interest (presumably fixed costs) as percents of sales as well as the interest coverage ratio.
Table 2

At first glance, small-cap fans may take comfort in seeing that the interest-burden as a percent fo sales is about the same as for large caps. Not so fast. What this is telling us is that small companies are actually quite prudent financially, and not over-leveraging. The interest coverage ratio, where small firms are at a distinct disadvantage, shows how interest expense, which is in line relative to sales, is actually much more burdensome after we deduct fixed costs and work our way down to operating profits.
Finally, Table 3 compares the two groups of companies on the basis of gross margin, operating margin, return on assets, and beta.
Table 3

Gross margin is the figure that is presumably more related to variable costs and is, therefore, the one we should expect to be more aligned. That’s not seen in the averages; the small-cap average is influenced by extreme outliers. But the medians are similar. Meanwhile, when we get to operating margin, which is where more of the presumably fixed costs are factored in, we see what we should expect; small-caps at a hefty disadvantage: We see this in the medians and now, in the averages, too. Finally, we also see small-caps trailing in return on assets.
Note, too, the way the small-cap average figures are some much more heavily influenced by outliers. If you’re going to step on a landmine, it’s much more likely as you walk across the small-cap landscape. The other side of the coin is that the small-cap field is the one in which you’re more likely to find the pot of gold.
Beta comparisons line up as we expect. More importantly, we see here that Beta is not to be seen as it typically is seen in quant finance. Beta is not simply a statistic to be naively adopted as many do by noting the computation (which is calculated based on historic share price trends). Beta is an end result of the inter-relationship of fundamental business factors that can and should be subject to analytic judgments about future direction. And when it comes to small-capitalization stocks, we should presume higher betas unless we see, in specific companies, reason to assume otherwise.
Small-Capitalization Going Forward
If small-capitalization is, in and of itself, the factor you wish to emphasize, as might be the case if you were considering a generic small-cap ETF such as the iShares Russell 2000 ETF (IWM) or the SPDR S&P 600 Small-cap ETF (SLY), I suggest thinking of a decision to own or not own along the lines of a market-oriented risk-on/risk-off choice. Quality/business-market risk is, as shown above, the essence of the choice between small-cap versus large-cap.
In terms of return potential, the market is indifferent between IWM or SLY relative to their large-capitalization cousins, the iShares Russell 1000 ETF (IWB) or the SPDR S&P 500 ETF (SPY). All carry Bullish Power Ranks at present. That’s so when we look at historical data (the PortfolioWise Volatility Assessments for SPY and IWB are low; for IWM and SLY, they’re High). As suggested above, we’d likely reach similar conclusions through fundamental study of the companies in which these ETFs invest.
Small-cap will outperform if and to the extent the market has a risk-on orientation.
In terms of popular thought, there may be another way to look at small-cap. It’s often presumed that smaller companies are less mature and capable of achieving stronger growth rates in the future. Be careful, however, in being too quick to generalize from folklore or anecdotal situations. Nowadays, we’re seeing a lot of the most exciting among these companies coming public with large initial offerings and whatever the state of their financial statements, they’re hitting the market as large-caps from day one. So small-cap per se is not the way to pursue such stories. If this is what you want, consider individual stocks, ETFs designed to aim at that area (you might find these in the Small-cap growth category), algorithmically or through actively-management, or thematic ETFs that aim at such companies regardless of market cap classification.
