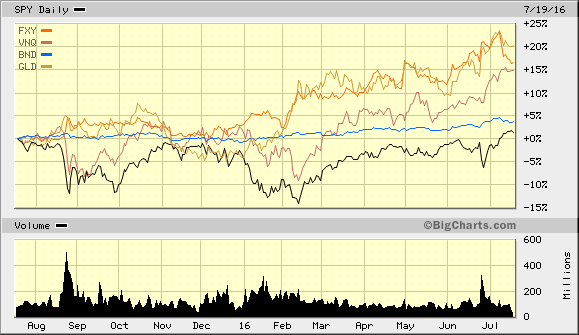
Are the new all-time highs in U.S. large cap stocks as big a deal as the media would have you believe? On a year-over-year basis, other asset classes have been more impressive.
Bonds, via Vanguard Total Bond Market (NYSE:BND), gold, via SPDR Gold Shares (NYSE:GLD) and the “risk-off” Japanese yen, via Guggenheim CurrencyShares Japanese Yen (NYSE:FXY) have all outperformed the S&P 500 SPDR S&P 500 (NYSE:SPY).
Vanguard REIT (NYSE:VNQ), that captures a wide range of real estate investment trusts has also proven to be a significant winner over the last 12 months.

Another puzzling aspect of the high profile hoopla? Very few analysts address the reward for taking equity risk. For example, the total return for the bond market has not only beaten the total return for the stock market in the period, the risk-adjusted reward for investment grade bond ownership has been far greater than the risk-adjusted nominal gains in stocks.
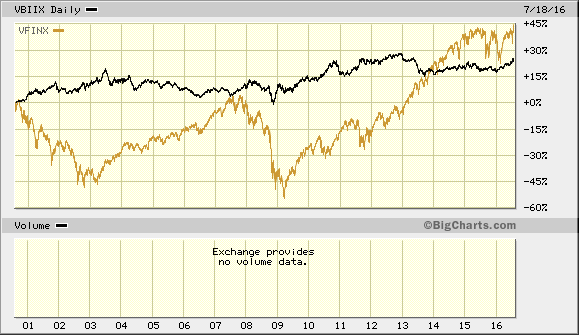
In fact, it is worth looking at how Vanguard S&P 500 (VFINX) has performed over the last 15 years relative to a bond proxy like Vanguard Intermediate-Term Bond Fund Index (VBIIX).
Granted, stocks out-hustled bonds as one might expect. Yet the risk-adjusted rewards associated with holding-n-hoping stocks through the tech-wreck (2000-2002) and the financial collapse (2008-2009) are not particularly impressive.

This is not to say that U.S. stocks are incapable of demonstrating their “risk-on” mettle from here forward. After all, in spite of my bearishness over the previous 19 months (when the Fed officially completed its last balance-sheet-expanding asset purchase on 12/18/2014), I have maintained roughly 45%-50% large-cap U.S. stock exposure for moderate clients.
The tactical shift that we made circa December of 2014 was to move from an indiscriminate risk taking posture (e.g., large, small, growth, value, foreign, etc.) to a higher quality, lower volatility, large-cap only positioning.
We made a similar tactical shift from a 30%-35% basket of diversified income (e.g., short, long, investment grade, higher yielding, foreign, etc.) down to roughly 25% investment grade bonds exclusively. That provided us with roughly 25% or more of the most opportunistic asset class of them all: cash/cash equivalents.
Perhaps ironically, with U.S. stocks hitting new highs, some folks have crawled out of the wood-works to slam the bearishness that I put forward over the past 19 months.
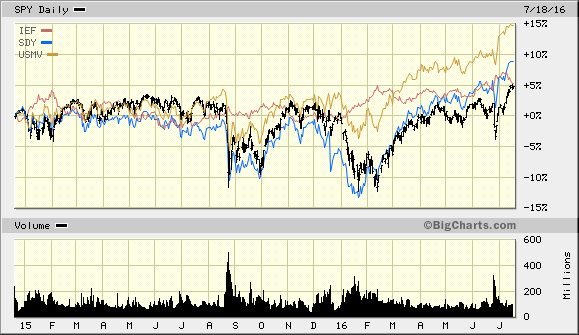
Naysayers might want to take a look at my well-documented core holdings over the 19 months, including SPDR S&P Dividend (NYSE:SDY),iShares Edge MSCI Minimum Volatility (NYSE:USMV) and iShares 7-10 Year Treasury Bond (NYSE:IEF).
The majority of the assets that I have been holding provided enhanced risk-adjusted returns over owning the S&P 500 SPDR Trust (SPY) alone. (The 25% cash component has been particularly beneficial.)

Investors regularly misunderstand the enormous benefits associated with a cash component for relatively short durations. For one thing, the asset class provides a buffer against unusual volatility; it provides the “sleep-at-night” factor which allows one the confidence to keep other assets rather than sell them in a panic.
Most importantly, however, having enough liquid cash in one’s corner gives an investor the ability to take advantage of bargains, price cuts and remarkable sales.
Do those beaten-to-smithereens bargains really exist in stocks, bonds or real estate right now? Quite the opposite, unfortunately. The primary asset classes (commodities excluded) have hit the second highest valuation levels in history.
And it really does not matter if you employ P/E ratios, P/S ratios, market-cap-to-GDP, Tobin’s Q, household equity-to-GDP, margin debt… you name it. Stocks are extremely overvalued.
That said, valuation methodologies typically identify longer-term outcomes of what one might expect over the course of a coming decade. They are not well-suited for identifying what will happen next week, next month or next year. The better method for ascertaining shorter-term market movement is investor risk preference.
Okay, then. Do investors currently prefer “risk-on” or “risk off” assets? Ironically… both.
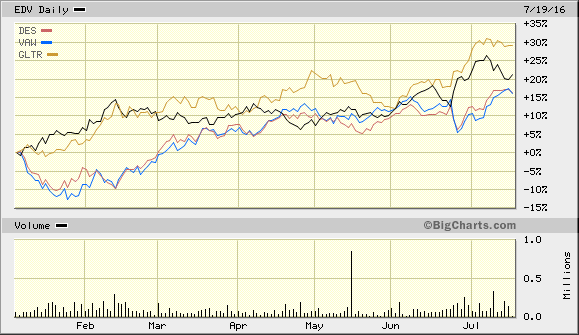
Consider the Relative Strength Factor (RSf) at ETFScreen.com. According to the web site, RSf is a percentile ranking of the price performance relative to all of the other market-based exchange-traded trackers in the ETF universe.
RSf employs an entire year of trading activity, though it emphasizes most recent performance by weighting it more heavily. Some of the top relative strength performers? “Risk off” assets like Vanguard Extended Duration (NYSE:EDV) and ETFs ETFS Physical Precious Metal Basket Shares (NYSE:GLTR). By the same token, “risk-on” holdings like WisdomTree SmallCap Dividend (NYSE:DES) and Vanguard Materials (NYSE:VAW) are not far behind in 2016.

The current trend for most of the asset classes is higher – stocks, preferreds, bonds, real estate investment trusts (REITs). You should participate. The central banks around the globe want you to stay invested.
On the other hand, we are already seeing how unconventional monetary policies have failed to work in places like Japan and Europe. Negative interest rate policy (NIRP) is not bolstering economic growth; asset purchases by foreign central banks have merely provided an additional avenue for foreign money to find its way into positive yielding U.S. debt and the perceived safety of U.S. stocks.
It stands to reason that whatever short-term gain might be occurring stateside, longer-term pain is the prescription when hyper-inflated valuations meet the diminishing efficacy of global monetary policy.
“Lower rates for longer” certainly sounds good on the surface. Then again, this was precisely the Federal Reserve’s solution for a struggling economy in the 2000s – the same Band-Aid that helped create the Great Recession.
My recommendation? Hold a chunk of your money in the most opportunistic asset class: cash/cash equivalents. Few things are as beneficial as having the readiness, desire, ability, liquidity and freedom to acquire total return dynamos at more favorable prices in the near future.
Disclosure: Gary Gordon, MS, CFP is the president of Pacific Park Financial, Inc., a Registered Investment Adviser with the SEC. Gary Gordon, Pacific Park Financial, Inc, and/or its clients June hold positions in the ETFs, mutual funds, and/or any investment asset mentioned above. The commentary does not constitute individualized investment advice. The opinions offered herein are not personalized recommendations to buy, sell or hold securities. At times, issuers of exchange-traded products compensate Pacific Park Financial, Inc. or its subsidiaries for advertising at the ETF Expert web site. ETF Expert content is created independently of any advertising relationships.
