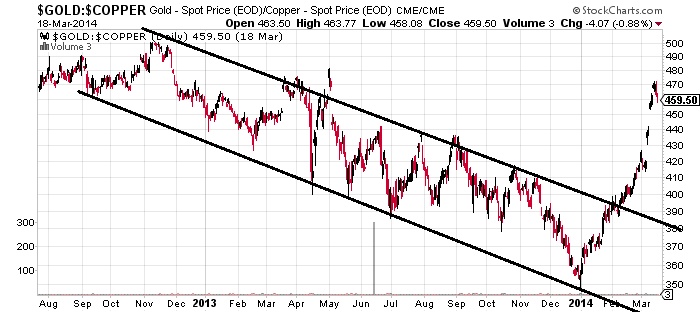
Copper is considered an industrial metal, used in industries across the board. When copper prices fall, it’s usually an indicator of a slowdown in the global economy. On the contrary, gold bullion isn’t much of an industrial metal; rather, it is used as a hedge against uncertainty in the global economy.
When you look at these two metals together, often referred to as the gold-to-copper ratio, they tell us something very important: the ratio of how many pounds of copper it takes to buy one ounce of gold bullion has long been an indicator of sentiment in the global economy.
If the gold-to-copper ratio is in a downtrend, it means investors are betting on the global economy to grow. In contrast, if it is increasing (if the number of pounds of copper it costs to buy an ounce of gold is rising), it tells us investors are concerned about protecting their wealth in a slowing global economy.
Below, you’ll find a chart of the gold-to-copper ratio.

Looking at the chart above, it is clear something happened at the beginning of 2014. Investors became very worried. Since the beginning of the year, the gold-to-copper ratio has increased more than 28%—the steepest increase in more than two years.
And the weekly chart of copper prices looks terrible too:

Chart courtesy of www.StockCharts.com
Copper prices have been trending downward since 2011. In 2013, these prices broke below their 200-day moving average and recently, they broke below a very critical support level at $3.00. While all of this was happening, on the chart, there was also a formation of a pattern called the “descending triangle.” It’s a bearish breakdown pattern that suggests prices are going to head much lower.
One must wonder how low copper prices can actually go. Just by looking at the descending triangle pattern, technical analysts usually target the price by measuring the widest distance on the pattern and subtracting it from where the price broke below. In simple terms, by that measure, copper prices may be heading toward the $2.00 level or lower, another 33% below where they are today.
After the financial crisis, the easy money supplied by the central banks in the global economy created the illusion that there was economic growth. But the reality was the complete opposite.
Now, the Federal Reserve is pulling back on its printing program. We recently heard that the central bank will be printing $55.0 billion a month in new paper money instead of the $65.0 billion it printed last month and the $85.0 billion it printed each month for most of 2013. (Source: Federal Reserve, March 19, 2014.)
Add to the Fed’s pullback on quantitative easing the troubles coming out of the Chinese economy, and it looks to me as if the global economy is going the wrong way. While politicians will simply choose not to talk about it, the mainstream media is directing investors the wrong way, just as the bear wishes; it’s leading investors back into the stock market, as if it’s a safe place to be again.
Dear reader, the truth is that the economy isn’t getting better; it’s getting worse.
Disclaimer: There is no magic formula to getting rich. Success in investment vehicles with the best prospects for price appreciation can only be achieved through proper and rigorous research and analysis. The opinions in this e-newsletter are just that, opinions of the authors. Information contained herein, while believed to be correct, is not guaranteed as accurate. Warning: Investing often involves high risks and you can lose a lot of money. Please do not invest with money you cannot afford to lose.