Speculation about how much longer General Electric Company (NYSE:GE) could remain part of the Dow Jones Industrial Average (DJI) has been swirling for months, and now it's official: GE will soon be replaced by pharmacy concern Walgreens Boots Alliance (NASDAQ:WBA). GE has been a Dow component on and off since the blue-chip index's conception in the late 1800s, so while the stock's removal from the Dow will certainly mark the end of an era, what could it mean for GE itself, and its (former) parent index?
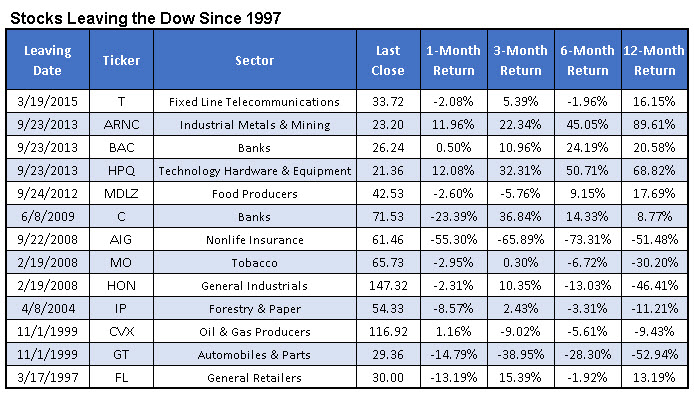
Below is a list of stocks that have been booted from the Dow since 1997. Since the March 2009 stock market bottom, these "blue-chip rejects" have done pretty well over the six-month and 12-month periods after their respective exits -- even Citigroup (NYSE:C) and Bank of America (NYSE:BAC), which took well-publicized hits in the aftermath of the financial crisis. Prior to the 2009 market bottom, however, stocks tended to struggle in their post-Dow lives. The Goodyear Tire & Rubber Company (NASDAQ:GT), Honeywell International Inc (NYSE:HON), and American International Group (NYSE:AIG) shed roughly half their value in the 12 months following their Dow dismissal.

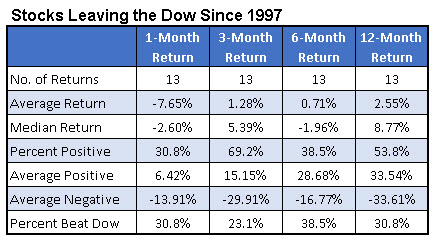
As you can see in the table below, which summarizes the returns for the 13 stocks above following their exit, the Dow's most recent ex-component tends to underperform the index; the percentage of individual stock returns exceeding those of the Dow falls as low as 23.1% over a three-month period -- and never rises higher than 38.5% (over a six-month stretch).

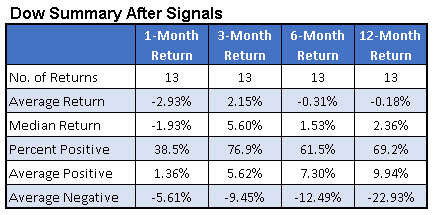
Drilling down on the Dow itself, here are the index's own returns following each of the aforementioned 13 departures. The DJI's median returns exceed those of its collective ex-members over every time frame, with the percentage of positive returns also considerably higher across the board. That said, average returns for the Dow over the six-month and 12-month periods lag those of its former members -- and note the stark difference in the Dow's average 12-month positive return (+9.94%) versus its average 12-month negative return (-22.93%).

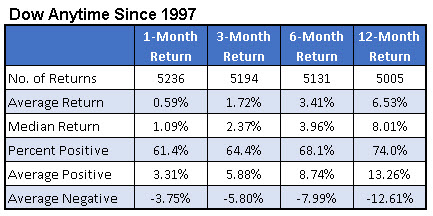
Meanwhile -- and perhaps most notably -- the Dow tends to underperform itself after booting a member. The table below displays the same index's own "anytime" returns since 1997 over these various time frames. Certainly, the small sample size measured above is a worthy caveat, but it's safe to say that the performance of the "anytime" Dow is considerably more bullish, by several orders of magnitude, than the performance of the post-ouster Dow (note, in particular, the average one-year return of -0.18% above versus +6.53% below).

In conclusion, if history is any guide, the implications of GE's dismissal from the Dow could result in significantly lackluster returns for the blue-chip index.
