The most widely-watched interest rate in the world rose to a level not seen in four years earlier this week.
The U.S. 10-year treasury yield, the global de-facto “risk-free” interest rate (the rate of return that theoretically bears no interest rate risk) rose to over 2.7 percent as bonds sold off.
Whilst a rising yield is a perfectly healthy by-product of an economy doing well, it exerts a tightening influence… in other words, it’s like applying the breaks on growth.
Corporate bond yields, for example, are priced and traded using their respective spread over the treasury rate. So when treasury yields rise, all else being equal, the cost of borrowing for companies in the bond market rises as well.
Thus, higher rates can constrain companies from borrowing to invest or grow.
An additional repercussion of rising bond yields is a corresponding sell-off in high dividend or yield stocks. Clearly, when bond market yields are low, then money will flow into dividend stocks (along with lower tier credit) looking for income.
As bond yields rise, those dividends start to look less attractive and as a result, those particular equity prices will readjust down – as price declines, their dividend yield therefore rises.
Sectors most at risk during a bond market sell-off include real estate stocks, real estate investment trusts (REITs), utilities, energy and basic materials – these are traditionally higher yielding equity sectors.
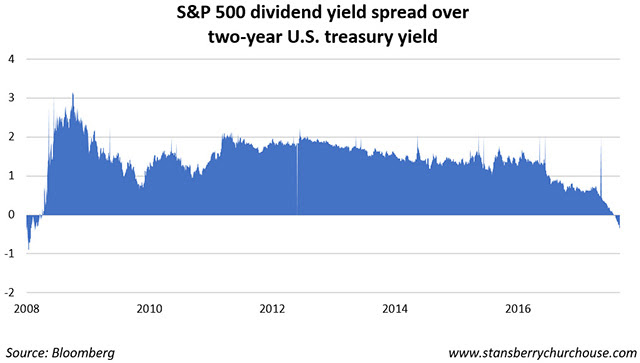
To give a sense of how far the pendulum has shifted, take a look at the following chart which shows the historical spread between dividend yield and short-term (2-year) treasury yields since the global financial crisis (GFC).
For well over half a decade, equities yielded 1 to 1.5 percent more than bonds. But since late last year, Federal Reserve tightening has not only closed the gap but reversed it entirely.

Of course, bonds don’t have the scope for capital gains that equities do, but the 2-year treasury right now yields over 2 percent, which is extraordinarily attractive compared to the sub-1 percent levels that characterised the post-GFC to end of 2016 era.
A longer-term look…
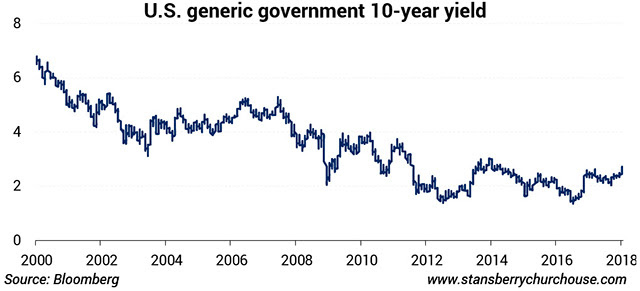
By historical standards, the recent sell-off barely registers. The chart below tracks yields back to 2000.

The bond market has essentially been in a bull market for 40 years, with yields trending downwards since the late 1970s.
In other words, there are actually very few active financial market participants who’ve ever even seen a U.S. treasury bear market in their lifetimes.
Are we looking at a reversal of this multi-decade trend now?
Trump vs. China: Make 10x from the smackdown
Donald Trump and China are about to go to battle… and prices of a small group of “hot commodities” will go up 1000%. Find how to position yourself before the gloves come off
Tightening
The Federal Reserve is projected to raise interest rates three times this year, with another two hikes forecast for 2019.
Should that transpire, then we should expect 10-year yields to increase unless the yield curve flattens substantially (i.e. if short-term rates rise and long rates remain the same, the curve flattens).
But it’s worth observing that the Fed’s projections of interest rates have been pretty dismal.
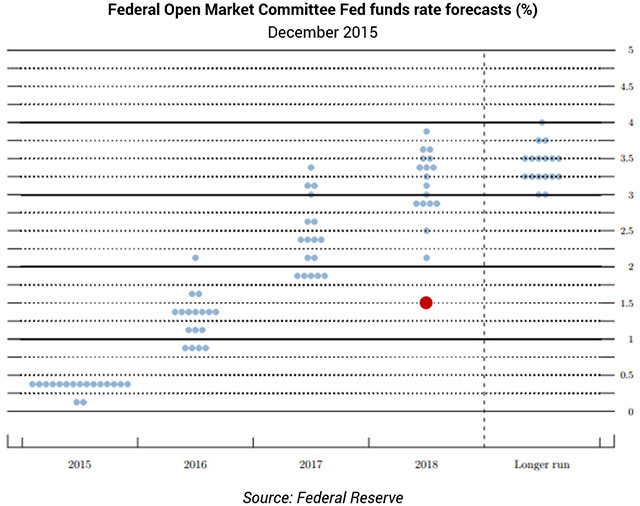
Take a look at the December 2015 forecasts for the Fed funds rate made two years ago in the following graph.
This chart, known as the “dot plot”, maps out the fed funds rate projections from the members of the Federal Open Market Committee (FOMC) – the 12-member committee that sets U.S. interest rates.
In late 2015, FOMC members expected the Fed funds rate to be around 3 to 3.5 percent in 2018. It’s currently at 1.5 percent.

What else is pushing a sell-off?
In addition to Fed tightening, other factors are conspiring to push yields up. A wave of corporate and personal tax cuts, a budget deficit (where the government spends more than it earns), along with an influx of repatriated overseas cash from firms who’ve long been socking profits away abroad to avoid tax, are all inflationary.
Inflation eats away at fixed income by essentially devaluing a bond’s future cash flows (both the coupons and the maturity value).
And with global central banks starting to wind down their quantitative easing programs, it removes a huge bond “bid” from the market.
If yields continue to trend up, the question is whether they do so in an ”orderly” fashion or not.
For a long time, the market has had its cake and eaten it too – in other words, owners of bond bonds and equities (and pretty much most financial assets) have profited on the back of low interest rates and central bank largesse.
If inflation finally rears its head in the U.S., then expect to see bonds sell-off even faster.
