August saw the global oil supply hit record highs as production reached 100 Million barrels per day. Analysts theorize this is the world’s top producer’s way of making up for the lost supply that once came out of Iran and Venezuela. However, based on oil’s new delve into the bear market province, that move may have been wholly unnecessary.
Overblown concerns regarding Iran and Venezuela: It appears that concerns over increased oil prices due to Iranian sanctions or an imploding Venezuela were misplaced. Several other Oil Market players have picked up Venezuela’s slack without problem. In addition, the U.S. exempted China and other large oil importers from the new Iranian sanctions.
The Russians and Saudis Deny any Reduction in Output: The rumor mill is buzzing with talk that both parties are looking to make cuts in their production of oil, though there are yet to be signs in actual production that this is true.
America’s Oil Production Continues to Grow: America now stands as the world’s largest producer of petroleum, with no signs of slowing down. This past Friday Baker Hughes, an Oilfield Services Firm, announced that the U.S. has added a dozen new rigs to the various oil fields across the country. Fracking advances has done a huge part to ensure that profits are high with minimal production costs.
Technical Indicators are Telling us:
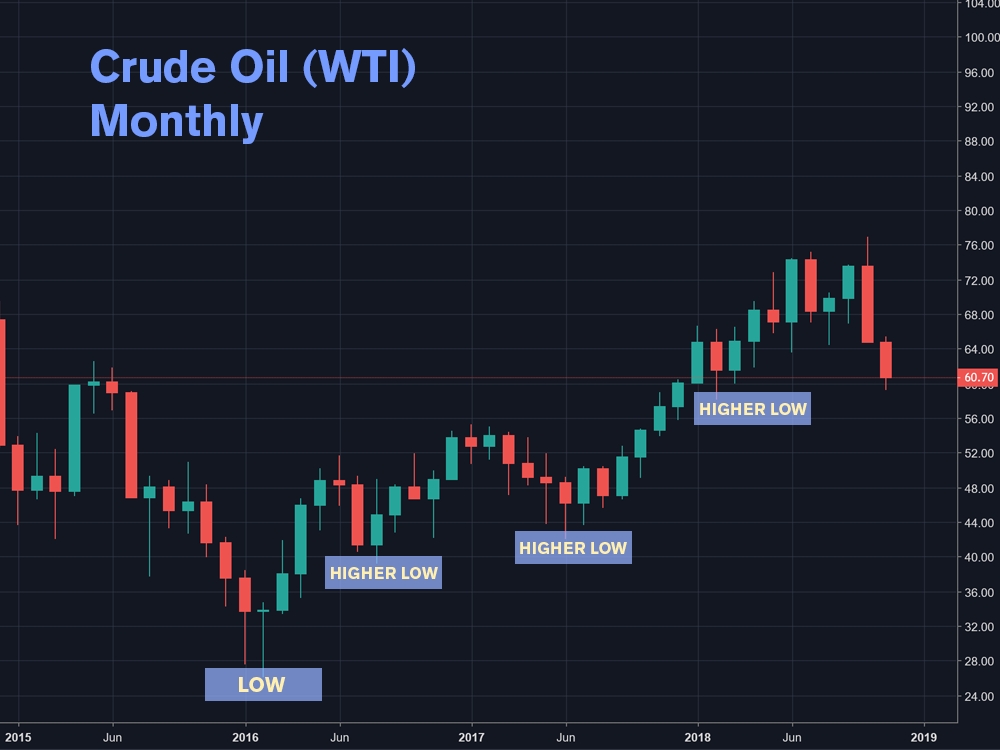
Higher highs and lower lows have become a pattern with WTI since way back in the winter of 2016 when the market tanked $26 a barrel. Crude oil prices hovered around $40 in July and within a few months a bullish market raised the price to $80, a high that hasn’t been seen since 2014.
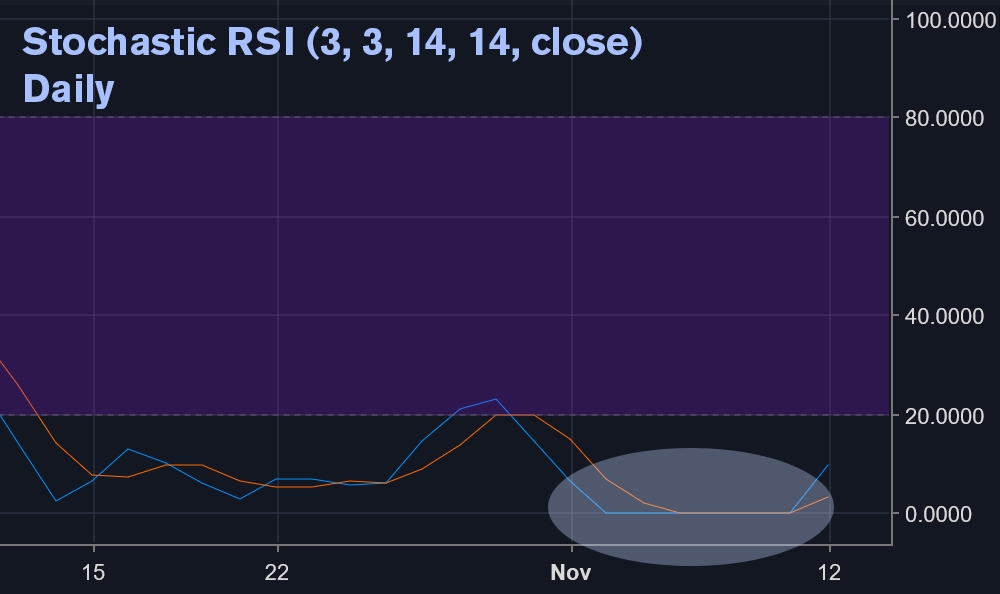
Two weeks in the red left WTI appearing oversold, per key indicators:
The Daily Stochastic RSI Daily flat lined for a full 5 days. The most recent instance of this was in May 2017 where a big jump was then recorded following the many days hovering at 0.
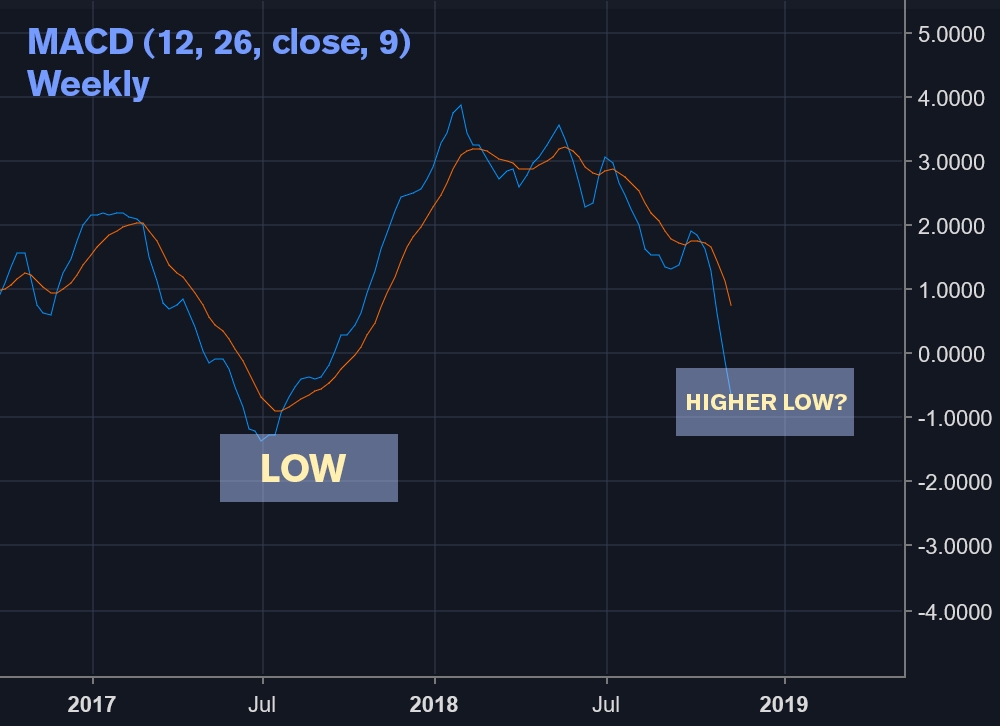
July has seen the lowest lows of MACD in the weekly charts since the summer of 2017. The last few months saw a series of lows with signs of an uptick to bring in a higher low on the horizon. Positive divergence, with the most recent instance of this trend having begun in 2017, would be realized if a lower low comes to fruition. That is, as long as prices don’t dip below $40.
Put these Price Points on Your Watchlist:
The past two weeks gave indications that WTI’s support would intersect at around $58 per barrel. This low was set back in February of this year.
What with many indicators oversold and support on the horizon, crude could be looking to reverse, for a little while at least.
But, should the market surpass this low, the economic and geopolitical factors will simply make trading too volatile for a bull stance to be taken. We might see an uptick to around $55 per barrel or go the opposite direction to as low as $40.
Regardless, exciting things will be happening in this market in the coming weeks. Where WTI Crude goes, the market tends to follow, so if it takes a nosedive we could be in for a world of hurt.


