Get 40% Off
🚨 Volatile Markets? Find Hidden Gems for Serious OutperformanceFind Stocks Now

We're Seeing A Correction In Ongoing Bull Market

Published 09/10/2020, 12:02 PM
Updated 07/09/2023, 06:31 AM

Executive Summary:

One week ago, investors fretted about keeping up as the stock market winners continued to march higher on a daily basis. But as the saying goes, trees don't grow to the sky, and our Early Warning Board gave us ample time to recognize that the "table had been set" for some counter-trend action.

I wrote last week:

"My guess is that when the bears do finally find a raison d'être (and they will, it's only a matter of time), we should expect the selling to be intense for a few days." 

I also opined that since we had a "good overbought" condition going, a catalyst would likely be needed for the bears to get up off the mat. Normally, a headline, a tweet or a shift in policy would be the trigger for the bears to get a selling party started. This time it was strange action in options and volatility that appeared to be the catalyst for the fastest move from an all-time high to "correction territory" on the NASDAQ Composite in history.

After a quick dance to the downside, which took the Nasdaq 100 down 10.9% and the S&P 500 nearly 7% in three days, stocks quickly reached oversold territory. As is usually the case, a bounce then ensued. Which brings us to today and the question of, where do we go from here?

My base case is we are seeing a correction within an ongoing cyclical bull market. We'll be watching the intermediate-term momentum indicators closely in the coming days/weeks as our key "tell" on the subject. In short, if the intermediate-term breadth indicators hold up (so far, so good), we can assume the bulls will regain control at some point soon. But if not, then some additional downside exploration can be expected.

3rd party Ad. Not an offer or recommendation by Investing.com. See disclosure here or remove ads .

Now let's take a look at our Early Warning Board for clues about the near-term action.

The State Of Early Warning Indicators

The Early Warning Board has clearly shifted this week. And while there is no "table pounding" message at this point in time, the bulls appear to have a slight edge on the board. However, I would expect the bears to put up a fight in the near-term in order to "test" the bulls' resolve going forward. And while the dip buyers could always run the indices right back to the highs, I'd prefer to see some further consolidation to further dampen the speculative froth that had developed. And since this pullback appears to have been driven by technicals, my best guess is the bulls will return to form in the next week or so.
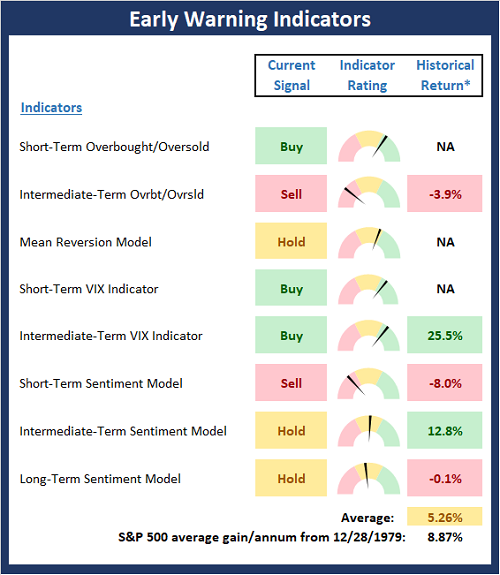
Early Warning Indicators.

* Source: Ned Davis Research (NDR) as of the date of publication. Historical returns are hypothetical average annual performances calculated by NDR. Past performances do not guarantee future results or profitability.

Stochastic Review

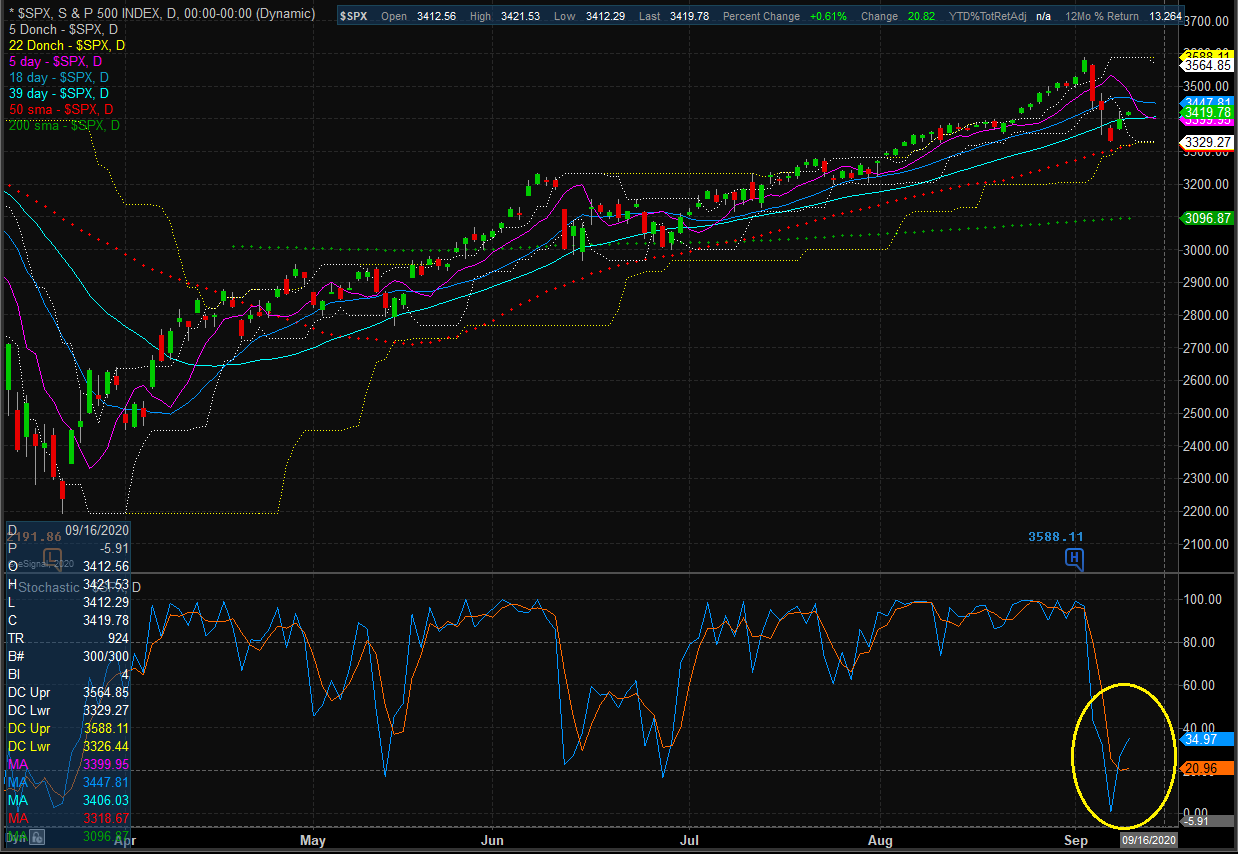
Last week, with the market overbought and investors clearly having become complacent, I wrote, "If the market follows the script, we can expect a scary decline in response to whatever fear comes out of the woodwork next. These bouts of selling tend to be short and sharp, and in my experience, represent a good time to put additional funds to work."

Sure enough, the ensuing decline unfolded as expected. The quick trip down pushed the stochastics into oversold territory and yesterday's reversal has triggered a short-term buy signal. The key from here will be whether or not the bears have any staying power and can produce a more prolonged oversold condition – which would be preferred from an intermediate-term perspective.

3rd party Ad. Not an offer or recommendation by Investing.com. See disclosure here or remove ads .

S&P 500 – Daily

S&P 500 Daily Chart.

Thought For The Day:

Not getting what you want is sometimes a wonderful stroke of luck.
- Dalai Lama

Latest comments

Wait until the market gets some real unemployment numbers, not what comes from Trump's Labor Department.
Why on earth would we continue to have a bull market??
cos there is too much liquidity.
No, the Fed returns are diminishing and are fully priced in, even at these lower levels. We’re not exceeding the prior top immediately, because investors/traders who didn’t sell quickly enough will provide a lot of supply at those levels, or even before, and be happy to break even, or almost, thus causing downward price pressure. Only after that supply is exhausted will the market continue an upward trajectory, but the election will almost certainly cause volatility in the months it will take to declare the winner.
Investor confidence is turning sour even with floods of liquidity, and US is not the only market in the world
The cult of Buy the Dip rallied for a single day before having having it wiped out immediately the next. We're sitting on the edge of a months-old upward trendline and sellers are back in control. Things are not looking good. What do you presume happens next? I suggest SPY 320 by at least end of month, but probably sooner.
Probably sooner
Don't get me wrong, I loved the ride up -- but it's always so much more fun on the way down! Whee!
Risk Disclosure: Trading in financial instruments and/or cryptocurrencies involves high risks including the risk of losing some, or all, of your investment amount, and may not be suitable for all investors. Prices of cryptocurrencies are extremely volatile and may be affected by external factors such as financial, regulatory or political events. Trading on margin increases the financial risks.
Before deciding to trade in financial instrument or cryptocurrencies you should be fully informed of the risks and costs associated with trading the financial markets, carefully consider your investment objectives, level of experience, and risk appetite, and seek professional advice where needed.
Fusion Media would like to remind you that the data contained in this website is not necessarily real-time nor accurate. The data and prices on the website are not necessarily provided by any market or exchange, but may be provided by market makers, and so prices may not be accurate and may differ from the actual price at any given market, meaning prices are indicative and not appropriate for trading purposes. Fusion Media and any provider of the data contained in this website will not accept liability for any loss or damage as a result of your trading, or your reliance on the information contained within this website.
It is prohibited to use, store, reproduce, display, modify, transmit or distribute the data contained in this website without the explicit prior written permission of Fusion Media and/or the data provider. All intellectual property rights are reserved by the providers and/or the exchange providing the data contained in this website.
Fusion Media may be compensated by the advertisers that appear on the website, based on your interaction with the advertisements or advertisers.
© 2007-2024 - Fusion Media Limited. All Rights Reserved.