As some market worries have been put to rest, there is a growing appetite for new ones. Pundits who say that things look OK are not very exciting. Last week we saw a shift in attention. Despite healthy earnings and good economic data, I expect pundits to be asking:
What should investors be worried about?
Last Week
Last week the economic news was good, but mostly ignored.
Theme Recap
In my last WTWA I predicted a week focused on geopolitical risks. Despite some attention to earnings, economic data, and the latest Trump Administration pronouncements, that proved to be a reasonable guess.
The Story in One Chart
I always start my personal review of the week by looking at an S&P 500 chart of market performance for the week. There was little change. The Thursday rebound was attributed to comments suggesting quicker movement on a tax reform package. If we measure the gain from the prior week’s close it is about 0.80%.
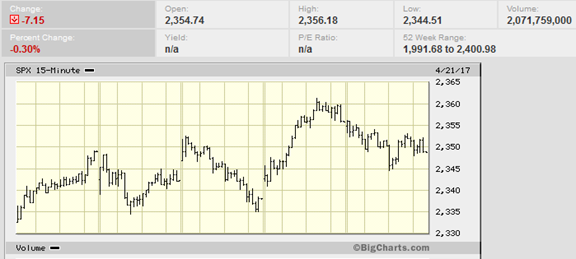
Whatever the news, the net market effect was (once again) very small.
The News
Each week I break down events into good and bad. Often there is an “ugly” and on rare occasion something very positive. My working definition of “good” has two components. The news must be market friendly and better than expectations. I avoid using my personal preferences in evaluating news – and you should, too!
Once again, the economic news last week was good. The market got a little boost.
The Good
- Trucking data is improving despite the mixed headline data. Steven Hansen (GEI) explains.
- Mortgage delinquencies declined to an 11-year low. (Calculated Risk).
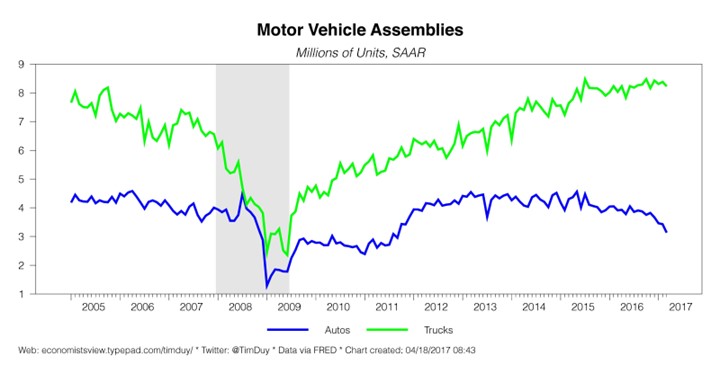
- Industrial production rose 0.5%. Eddy Elfenbein notes the weakness in factories and the strength in utilities.
Tim Duy also takes a closer look, noting the weakness in autos and the strength in utilities. He also cites the American interest in larger cars.
- Q1 Earnings.
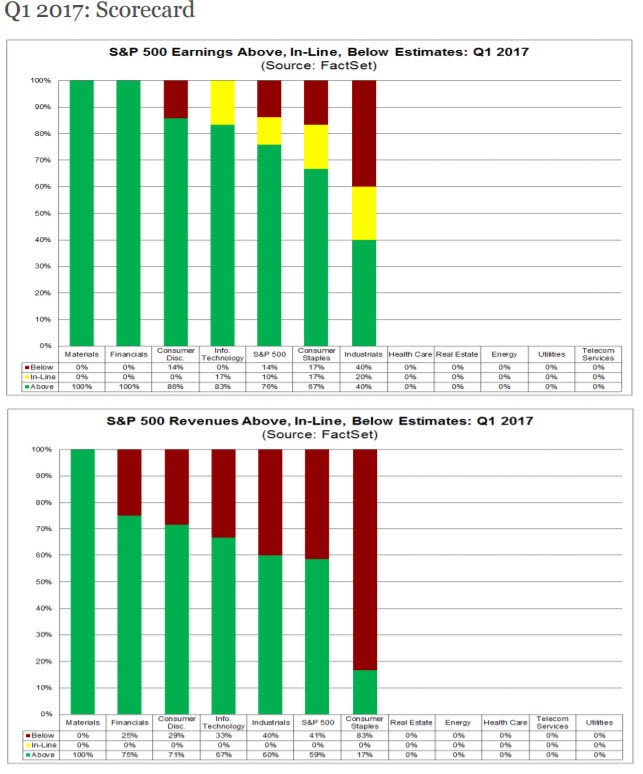
FactSet notes that reports are beating the historical metrics. Brian Gilmartin calls attention to the lag in energy stocks. Here is the key quote from John Butters:To date, 6% of the companies in the S&P 500 have reported actual results for Q1 2017. In terms of earnings, more companies (76%) are reporting actual EPS above estimates compared to the 5-year average. In aggregate, companies are reporting earnings that are 6.7% above the estimates, which is also above the 5-year average. In terms of sales, more companies (59%) are reporting actual sales above estimates compared to the 5-year average. In aggregate, companies are reporting sales that are 0.2% above estimates, which is also above the 5-year average.
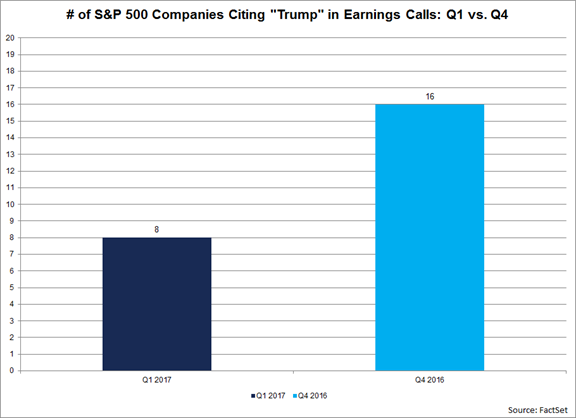
And fewer companies are citing President Trump as a factor. It is a small sample so far, but interesting to watch.
- Philly Fed remained strong with a reading of 22. This is especially good for a diffusion index, which measures month-over month changes. We cannot expect the pace of increases to be maintained. Few understand this and fewer mention it.
- Initial jobless claims rose to 244K, which some may see as bad. Most follow this noisy series via the four-week moving average, which moved lower.
- Existing home sales were up 4.4%. Calculated Risk notes that warmer weather was a factor. Bill also expects increasing inventory, which will help future sales.
- Chinese economic growth was 6.9%, beating expectations. (FT)
The Bad
- Hotel occupancy rates declined by 4.6%. Calculated Risk reports and notes the possible effect of a shift in Easter from March in 2016 to April in 2017.
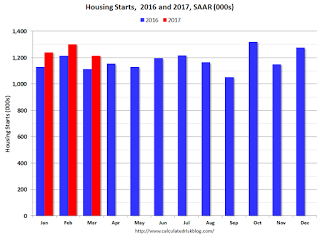
- Housing starts declined from February, but increased 9.2% over last year’s easy comparison. Overall, starts are up 8.1% YTD. Calculated Risk is sticking with a forecast of a 3% to 7% gain for the year. Check out the post for a solid discussion of this difficult series.
The Ugly
Following up on an item from last year, cell phone use by drivers is nearly universal. Sensor data show that the phones are used in 88% of trips.
Blowing up a soccer team’s bus to make money on the team’s stock options is also ugly.
The Silver Bullet
I occasionally give the Silver Bullet award to someone who takes up an unpopular or thankless cause, doing the real work to demonstrate the facts. No award this week, but nominations are always welcome. There are many bogus claims and charts out there!
This week I was especially disappointed with coverage – even by mainstream media – of the IMF report on world financial risk. From most of the stories you would never know that risk had decreased. One major source even reposted a typical ZH piece – no links, poor writing, extensive quotes without citations, etc. Sadly, many more people read this than the original report or any unbiased accounts.
The Week Ahead
We would all like to know the direction of the market in advance. Good luck with that! Second best is planning what to look for and how to react. That is the purpose of considering possible themes for the week ahead. You can make your own predictions in the comments.
The Calendar
We have a normal week for economic data.
The “A” List
- Consumer confidence (T). Expect some decline from record levels.
- Michigan sentiment (F). A good read on employment and economic well-being.
- New home sales (T). Continuing strength needed in this important sector.
- Q1 GDP (F). This first estimate will be revised (perhaps heavily) but will still grab attention.
- Initial jobless claims (Th). Is the series edging up from record low levels?
The “B” List
- Pending home sales (Th). Not as important for economic expansion is new sales, but still a good market read.
- Durable goods (Th). March data, but still important.
- Employment cost index (F). A sign of labor market tightening?
- Chicago PMI (F). Most important of the regional indexes, especially when the national report is in following week.
- Crude inventories (W). Recently showing even more impact on oil prices. Rightly or wrongly, that spills over to stocks.
The schedule is light on FedSpeak, but there will be plenty of earnings news.
Next Week’s Theme
In a normal week, the Q1 earnings season would continue as our theme. While dramatic moves in some stocks grab attention, the overall market interest emphasizes what to worry about. Since some of the recent problems do not seem as threatening, it is time for a fresh supply. Expect many to be asking:
What should investors be worried about?
There are four leading candidates:
- A government shutdown. Action is needed by the end of the week. Ever-changing rumors suggest that the vote will be linked to an ObamaCare repeal or some other topic. Expect this to get plenty of attention all week, since these issues are never resolved until the deadline.
- The French election. It’s a revolution no matter which front-runner wins, says a French political scientist and adviser to a former Prime Minister. (Interesting post). It could lead to rioting. (The Telegraph).
- The Trump agenda is in jeopardy. The President and his team have a business approach, but often do not recognize legal and political limitations. Some were disturbed by the recent account of the Trump/Merkel meeting, where the President did not understand the laws related to trade agreements – despite an explanation repeated ten times. (The British version).
- Market valuation. This multi-year topic got a fresh boost this week. The concept of an expensive market is now conventional wisdom. It implies that long-term investors are stupid, dumb money, and facing excessive risk. Just as they have been for years. Investors are worried about a crash, according to Goldman.
These are very important questions. Understanding a “wall of worry” is a fundamental concept for investors. Many think that a list of worries is bad. That is wrong. Well-documented concerns are reflected in current pricing. I tried to explain this concept in 2009:
Many observers express surprise that the market can rally in spite of “the fundamentals.”
This is the wrong question. The best time to invest is when things look terrible and prices reflect the poor current conditions. I wrote an article on this topic in mid-April of 2009 that I thought was one of my best. A commenter, probably reflecting many others, offered a skeptical “Good luck with that.” It is difficult, unpopular, and profitable to have a bullish market viewpoint when the general news flow is so negative…
…How can stocks rally with so much to worry about? To answer this question you need to consider what these lists would have been like a month ago. Some of the worries have been crossed off! Others have been reduced.
The crash of the Euro, the sovereign debt crisis, and the “cockroach theory” have not come to pass.
Corporate earnings have remained strong — both current and prospective — despite skepticism.
None of the extreme “technical” forecasts — Hindenburg Omen, head-and-shoulders top, Death Cross, or Dow Theory signals came to pass. Some are now reversing.
If you watch the lists of worries as they change over time, you can see that some important concerns drop off. This climbing of the “wall of worry” best explains both the current market action, and also the week ahead.
This concept, along with our market indicators, helped in achieving my 2010 prediction of Dow 20K. The actual forecast was important. The underlying reasoning and method even more so.
As usual, I’ll have more about the new worries in my Final Thought.
Quant Corner
We follow some regular featured sources and the best other quant news from the week.
Risk Analysis
Whether you are a trader or an investor, you need to understand risk. Think first about your risk. Only then should you consider possible rewards. I monitor many quantitative reports and highlight the best methods in this weekly update.
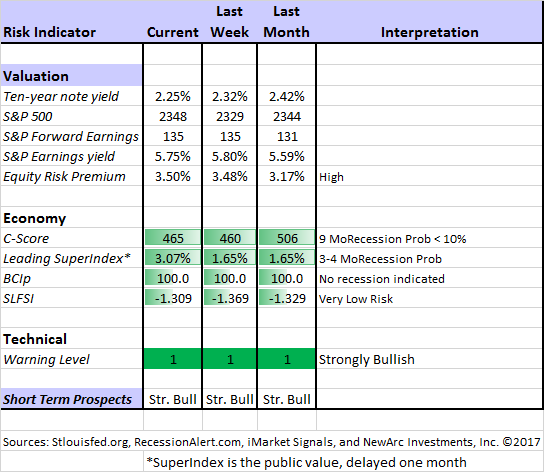
The Indicator Snapshot
The Featured Sources:
Bob Dieli: The “C Score” which is a weekly estimate of his Enhanced Aggregate Spread (the most accurate real-time recession forecasting method over the last few decades). His subscribers get Monthly reports including both an economic overview of the economy and employment.
Holmes: Our cautious and clever watchdog, who sniffs out opportunity like a great detective, but emphasizes guarding assets.
RecessionAlert: Many strong quantitative indicators for both economic and market analysis. While we feature his recession analysis, Dwaine also has several interesting approaches to asset allocation. Try out his new public Twitter Feed.
Georg Vrba: The Business Cycle Indicator and much more. Check out his site for an array of interesting methods. Georg regularly analyzes Bob Dieli’s enhanced aggregate spread, considering when it might first give a recession signal. His interpretation suggests the probability creeping higher, but still after nine months.
Brian Gilmartin: Analysis of expected earnings for the overall market as well as coverage of many individual companies.
Doug Short: The World Markets Weekend Update (and much more). His Big Four chart is the single best method to monitor the key indicators used by the National Bureau of Economic Research in recession dating. The latest update now includes the employment data.
Focus Economics did an interesting post on why productivity growth is so low. I was one of the 23 “experts” who commented. The answers are a bit uneven, but interesting. Take a look.
How to Use WTWA (especially important for new readers)
In this series, I share my preparation for the coming week. I write each post as if I were speaking directly to one of my clients. Most readers can just “listen in.” If you are unhappy with your current investment approach, we will be happy to talk with you. I start with a specific assessment of your personal situation. There is no rush. Each client is different, so I have eight different programs ranging from very conservative bond ladders to very aggressive trading programs. A key question:
Are you preserving wealth, or like most of us, do you need to create more wealth?
Most of my readers are not clients. While I write as if I were speaking personally to one of them, my objective is to help everyone. I provide several free resources. Just write to info at newarc dot com for our current report package. We never share your email address with others, and send only what you seek. (Like you, we hate spam!)
Best Advice for the Week Ahead
The right move often depends on your time horizon. Are you a trader or an investor?
Insight for Traders
We consider both our models and the top sources we follow.
Felix, Holmes, and Friends
We continue with a strongly bullish market forecast. All our models are now fully invested. The group meets weekly for a discussion they call the “Stock Exchange.” In each post I include a trading theme, ideas from each of our five technical experts, and some rebuttal from a fundamental analyst (usually me, but sometimes a guest expert). We try to have fun, but there are always fresh ideas. Last week the group contrasted long and short-term themes.
Top Trading Advice
Brett Steenbarger is required reading for traders. My favorite this week is his discussion of Cyclically Adaptive Trading. You must read the entire post to understand this approach, but we should expect more on this theme. Does this sound familiar?
When traders refer to the difficult trading environment, they often make reference to “choppy” or “noisy” markets. Usually their next sentences lament the “algos” and their impact upon markets. I find these to be expressions of frustration, not constructive formulations of trading challenges. Invariably, those lamenting choppy markets dominated by algos that “manipulate” markets engage in their venting–and then go back to trading as they’ve always traded…and continue to lose money.
Gatis Roze has ideas about to deal with losses – and how not to!
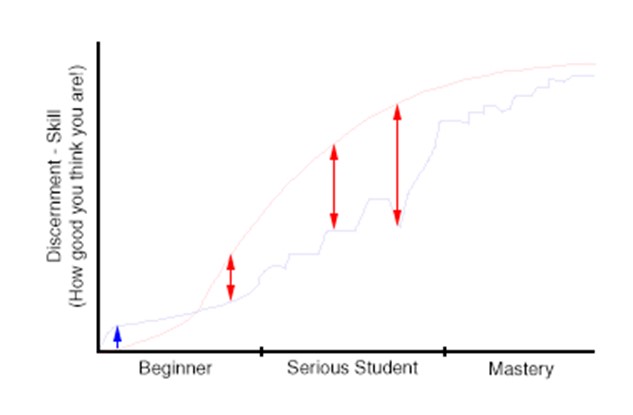
Adam H. Grimes has an interesting post on the difference between developing skills and our perceptions of success. While it fits the normal trading themes, this has much broader interest.
Insight for Investors
Investors have a longer time horizon. The best moves frequently involve taking advantage of trading volatility!
Best of the Week
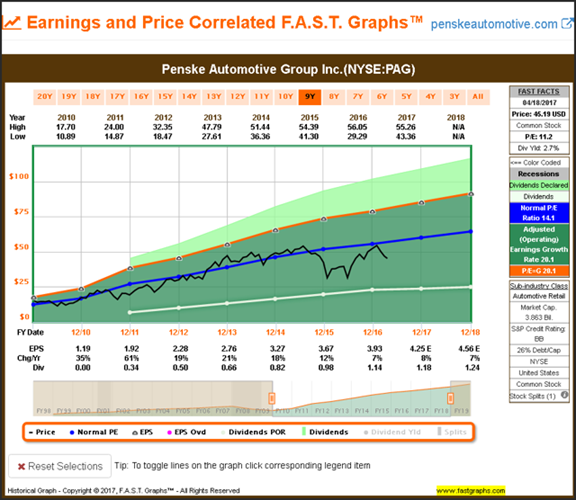
If I had to pick a single most important source for investors to read this week it would be Chuck Carnevale’s excellent analysis of Penske Automotive Group (NYSE:PAG). Chuck always has great stock ideas, but he often includes a lesson about how to find the best opportunities. This is a great example – well worth studying by DIY investors. His research uses information from the company, like this chart:
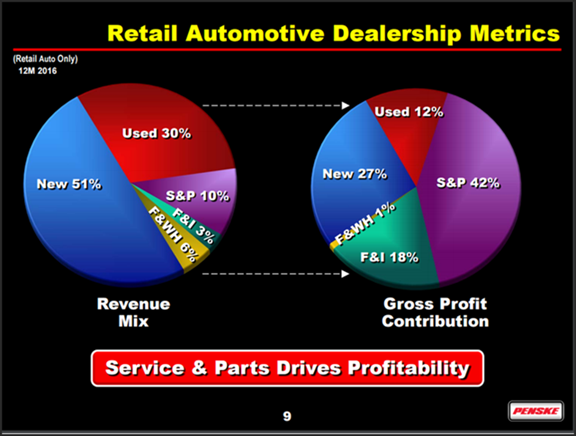
This is crucial if you want to understand the profit drivers, but it is only a start. Among many other points, he also includes one of the most important summary charts from his excellent resource. (I never invest in a stock without checking it out at F.A.S.T. Graphs, and that helped us to find PAG more than a year ago).
Stock Ideas
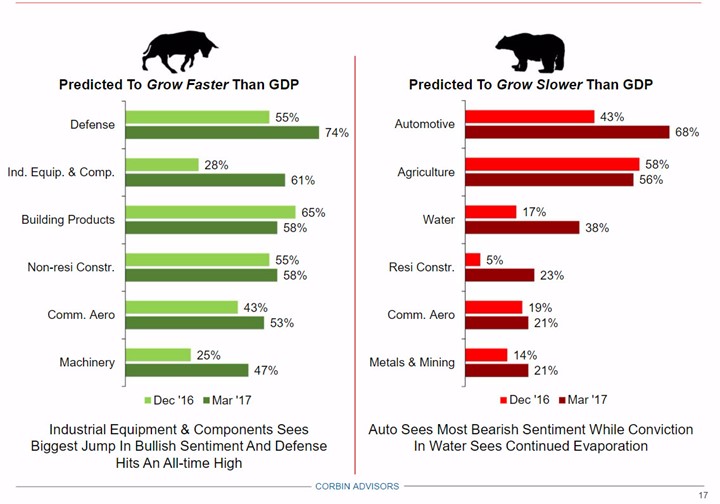
Corbin Perception’s Industrial Sentiment Survey is loaded with great information from big-time buy-side investors and analysts. Here is a sample – something I found interesting.
Barron’s has some interesting ideas this week. Big banks, Sarepta (NASDAQ:SRPT), and O’Reilly (NASDAQ:ORLY) all get strong mentions. There is also a nice feature on Bespoke Investment after ten years. It includes some of their picks and pans – interesting lists!
Brad Thomas suggests some “battle-tested” REITs.
Peter F. Way uses an interesting approach – hedging by market-makers doing big-volume trades. These actions reflect their expectations about risk and reward. He reports the results on the Dow stocks.
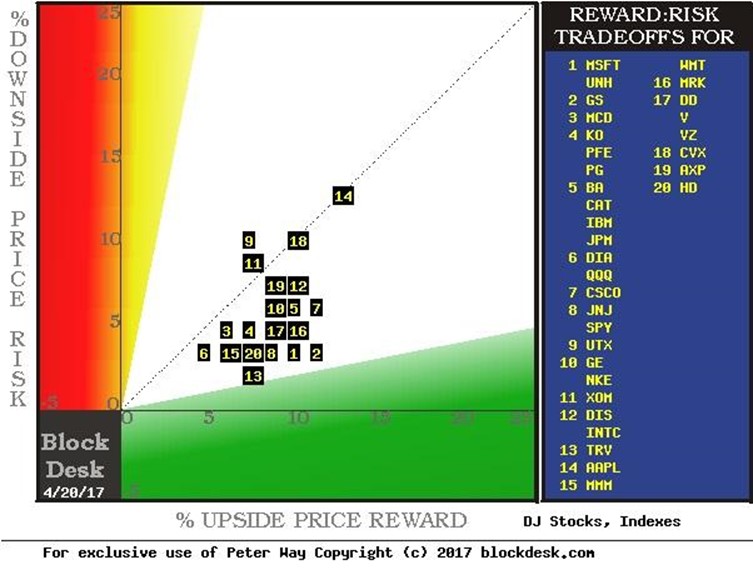
The entire article will help your interpretation, but Goldman Sachs (NYSE:GS), Microsoft (NASDAQ:MSFT), and United Health Care (NYSE:UNH) are the most attractive.
Our Stock Exchange always has some fresh ideas. There are ideas from five different approaches. This week Felix emphasizes energy while Holmes likes Discover Financial Services (NYSE:DFS).
Personal Finance
Professional investors and traders have been making Abnormal Returns a daily stop for over ten years. If you are a serious investor managing your own account, this is a must-read. Even the more casual long-term investor should make time for a weekly trip on Wednesday. Tadas always has first-rate links for investors in his weekly special edition. As usual, investors will find value in several of them, but my favorite is the analysis of annuities. Here is how a variable annuity works (without the regular sales pitch). Here is how to create one yourself.
I have emphasized the regular personal finance feature at Abnormal Returns, but the offerings have become much more diverse. I follow them all, often finding items of personal interest as well as ideas for WTWA. If you have not recently checked out the site, it is time for another look. You can also get special benefits by becoming a member.
Seeking Alpha Editor Gil Weinreich’s series for investment advisors is useful for individual investors as well. The well-chosen topics span important questions and provide helpful links. I loved this week’s post on the value of time. Here is a key quote:
Sadly, many people who reach “retirement” (I confess, I do not like that word) experience depression because they don’t know what to do with themselves. My two cents: Whatever your ideal vision of retirement may be, start enjoying it now to ensure that you will enjoy it even more then.
How true! In my research this week, I learned that the average daily use of mobile devices for Americans is…..Make your guess and see the answer at the end of the post. Also, Netflix (NASDAQ:NFLX) reports that members have spent 500 million hours watching Adam Sandler movies.
Market Outlook
Schwab has an excellent discussion of reflation – a key market theme. The term is frequently used, but many do not understand it.
Reflation is the process of getting economic growth and price broadly back to pre-recession levels. While progress has been made, growth is still not accelerating. First quarter real gross domestic product (GDP) is forecasted to come in around a 1% annualized level according to Bloomberg. Add in disappointment with the political developments—the hoped for stimulus coming from Washington is at least delayed; the Federal Reserve is talking about reducing its balance sheet; and geopolitical tensions are rising—and you have a good mix for investors to pare back some risk. Stocks have trended modestly downward, while more cyclical areas of the stock market have struggled at the expense of more defensive areas. We’ve also seen yields reverse course after surging on hoped for fiscal stimulus and rising economic growth.
Their overall conclusions are constructive. They address many key concerns – examining and charting the data.
Watch out for…
Value traps. Simply Safe Dividends does a typically fine analysis of Cardinal Health (NYSE:CAH). Even though it is a dividend aristocrat, there are warning signs.
Final Thoughts
What should we think about today’s key questions?
- Government shutdown. I expect this to be avoided. The ideal solution would be an element of bipartisan compromise. The danger? Too many “extras” tacked on.
- French election. I have no special insight into the outcome. (FiveThirtyEight says it is way too close to call). By the time you read this, we may have the result for this round. One safe prediction is that this story, whatever the initial outcome, will be with us for a couple of months as the runoff occurs, followed by legislative elections. There are plenty of stories with dire predictions. Historically, the press (especially the financial press) has dramatically over-estimated these effects. We shall see. (Some other opinions).
- Trump agenda. There has been a challenging learning curve in the first 100 days. For those who think the post-election rally was all about Trump, this is a problem. For those of us who expected this rebound, regardless of the election outcome, market-friendly policy changes remain as potential upside. Charlie Bilello has a nice, chart-packed analysis of the market’s “false narratives.” He has a great analysis of the “Trump stocks” and themes.
- Market valuations. The table pounding continues. I have written on this topic in detail, including analyses of all the “favorite” valuation indicators – none of which are currently used by the inventors. “Skin in the game” is usually an important test for market cynics. Why do they think that others (like Paul Tudor Jones) can interpret the Buffett indicator better than Mr. B? Check out his reasoning here in his Dow 100K comment.
I am going to attempt a simple and brief explanation of the current valuation issue. It involves a “thought experiment” like Einstein’s in developing the Theory of Relativity. (I love and recommend Walter Isaacson’s biography).
Suppose you are given the chance to purchase an asset for $100,000 with an annual payment of $10,800, a rate of 10.80%. Your personal rate of inflation is 13.5%.
Suppose instead that you are given the chance to purchase an asset for $100,000 with an annual payment of $2224, a rate of 2.24%. Your personal rate of inflation is 1.8%.
Which is the better buy? Which should cost more? When inflation is high, both assets look cheap. When it is low, both look dear. BTW, the examples use actual data from 1980 and 2017.
If you understand this example, you see why prospective inflation and interest rates are important for valuing both stocks and bonds. Sources that discusses stock valuation, using only historical data, are telling only part of the story. Ignore them.
Valuation for all assets is relative. If Einstein were with us, he would agree with Mr. Buffett.
[Answer to mobile device question: Five hours per day. That includes streaming Adam Sandler movies.]
