
The economic calendar is normal, with an emphasis on housing and sentiment data. Earnings season is in full swing and expectations remain high. We have witnessed improvement on several fronts. Since that is not very newsworthy, the punditry will be asking:
Where can we find some fresh fears?
Last Week Recap
In my last edition of WTWA I asked whether strong earnings were already reflected in stock prices. That was a good guess, as each good earnings report was explained as “strong” or “anticipated,” depending upon whether the stock subsequently moved higher or lower.
The Story in One Chart
I always start my personal review of the week by looking at a great chart. I always start my personal review of the week by looking at a great chart. I especially like the version updated each week by Jill Mislinski. She includes a lot of valuable information in a single visual. The full post has even more charts and analysis, so check it out.

The gain for the week was about 0.5%, and the trading range was only about 2%. I summarize actual and implied volatility each week in our Indicator Snapshot section below.
Noteworthy
Amazon (NASDAQ:AMZN) has over 100 million subscribers to their “Prime” service, including 55% of the households in the US. (Barron’s)
Nearly half of crypto traders do not pay taxes. (MarketWatch).
Google’s web presence dominates everyone else put together. (Visual Capitalist)

The News
Each week I break down events into good and bad. For our purposes, “good” has two components. The news must be market friendly and better than expectations. I avoid using my personal preferences in evaluating news – and you should, too!
Feel free to add items that I have missed. Please keep in mind that we are looking for current news, especially from the last week or so. WTWA is not about long-term concerns like debt. These are important, of course, but not our weekly subject unless there has been some major change.
The Good
- High frequency indicators remain positive (New Deal Democrat).
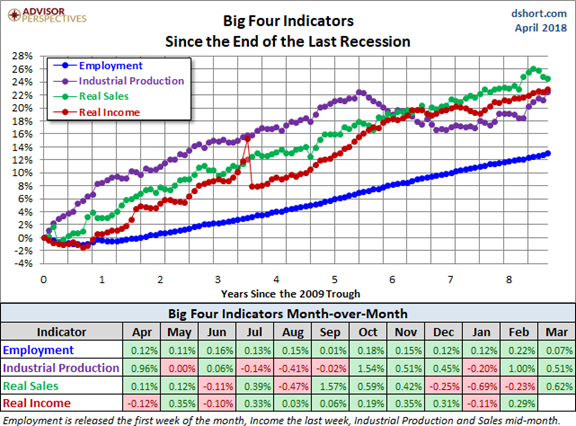
- Industrial production increased 0.5%, down from 1.0% in February, but beating expectations of 0.3%. (Jill Mislinski, and see the Big Four update below)
- Hotel occupancy broke records in Q1. Some astute readers pointed out that a past analysis was wrong because of holiday timing. Mrs. OldProf, who reads both the posts and the comments each week, jumped on this. “See, your readers agree with me!” Thirty-eight years and as mistake-prone as ever. Calculated Risk provides analysis and this chart.

- Retail sales increased 0.6%, beating expectations of a 0.4% bump.
- Mortgage delinquency rates are lower. Those thirty days past due – 3.73%. In foreclosure – 0.63%. (Calculated Risk).
- Corporate earnings are strong, regardless of the chosen metric – beat rate, size of earnings and revenue beats. John Butters reports:
To date, 17% of the companies in the S&P 500 have reported actual results for Q1 2018. In terms of earnings, more companies are reporting actual EPS above estimates (80%) compared to the 5-year average. In aggregate, companies are reporting earnings that are 5.9% above the estimates, which is also above the five-year average. In terms of sales, more companies (72%) are reporting actual sales above estimates compared to the five-year average. In aggregate, companies are reporting sales that are 1.6% above estimates, which is also above the five-year average.
Brian Gilmartin agrees, but is more concerned about the effect of higher interest rates.
- Corporate cash is increasing (WSJ) suggesting room for higher dividends and more stock buybacks. David Templeton (HORAN) explains, illustrating with this chart.

- Housing starts for March hit a seasonally adjusted annual rate of 1319K, beating expectations by 4%. Building permits of 1354K also beat expectations. Calculated Risk comments on the data (mostly due to multi-family starts) and also on Homebuilder Confidence – down one point at 69, but still on “firm ground.”

The Bad
- Jobless claims were almost unchanged from last week at 232K, but this was 5K worse than expectations. (Bespoke)
- The Beige Book supported the current Fed picture of modest growth, but also had some warnings about the impact of current policies. Companies mentioned spikes in aluminum and steel prices. (Business Insider).
- Leading indicators increased only 0.3%. This is a gain, of course, but smaller than the February pace of 0.7% and slightly below expectations of 0.4%. Jill Mislinski provides analysis and charts.

The Ugly
How about something that is responsible for 2.3 million annual deaths? From the International Energy Agency:
Today around 2.8 billion people – 38% of the global population and almost 50% of the population in developing countries – lack access to clean cooking. Most of them cook their daily meals using solid biomass in traditional stoves. In 25 countries, mostly in sub-Saharan Africa, more than 90% of households rely on wood, charcoal and waste for cooking. Collecting this fuel requires hundreds of billions of hours each year, disproportionately affecting women and children. Burning it creates noxious fumes linked to 2.8 million premature deaths annually.
Timothy Taylor explains:
The report estimates that an investment of an additional $42 billion, above and beyond what is already happening, would be needed by 2030 to provide access to clean cooking for the 2.3 billion people who otherwise will not have access to clean cooking by that time. At one level, $42 billion is a lot of money: at another level, it’s almost an absurdly cheap price to pay for the potential benefits.
The Week Ahead
We would all like to know the direction of the market in advance. Good luck with that! Second best is planning what to look for and how to react.
The Calendar
We have a normal economic calendar, featuring housing data, Consumer confidence and sentiment, and the first look at Q1 GDP. Corporate earnings reports will again be the most important real news.
Briefing.com has a good U.S. economic calendar for the week (and many other good features which I monitor each day). Here are the main U.S. releases.

Next Week’s Theme
The economic calendar emphasizes housing data and sentiment polls. The focus, barring important tweets to the contrary will continue to be corporate earnings reports.
The quest to find an explanation for every market move reached a new peak last week. With evidence of good earnings, a stronger economy, and positive sentiment, an explanation was needed for the volatile market. Why is it flat at lower levels? I expect pundits and financial writers to be asking:
Where can we find some fresh fears?
One of the better CNBC anchors gave us a taste of what to expect. Chip stocks had moved lower, mostly because of events related to a single stock. With the ETF connections and algorithmic trading, the entire sector got hit and dragged the market down as well. (That’s the best I can do here, but I promise more in a special post. Meanwhile, I love most chip stocks, especially Lam Research (NASDAQ:LRCX)).
The anchor asked her guest. Aren’t semiconductor stocks cyclical? If this is the top of the cycle, what does it say about the overall economy?
That question could be a litmus test for traders versus investors.
There is plenty of reaching to find something wrong, and that was just one example. Here are some currently-raised concerns:
- Yield curve inversion. So many who are rookies at recession forecasting are jumping on the yield curve inversion. Dr. Robert Dieli, the top expert on this topic, repeatedly warns not to forecast this signal. When it occurs, it will still provide lead time of about nine months. And it is more than just the yield curve. One must also consider the economic background and confirming indicators. Despite this, many are reaching far into the future.
- Hale Stewart – a real possibility in the next 18 months. I frequently cite Hale on various topics, but economic forecasting is not his happy zone. Speculating on this topic is not helpful to investors.
- Another favorite source, Pension Partners, seems to be reaching on this topic.
- Barron’s notes, citing Dan Clifton (a good source), “My take from discussing the issue with clients is that the headwinds from a possible trade war are colliding with the tailwinds from $300 billion of additional stimulus from spending on top of the recently enacted tax cuts.”
- The Fed. A knee-jerk reaction to the direction of Fed moves and old slogans. Those citing this fear pay little attention to the starting level of rates, the pace of change, or the criteria for increases (stronger economic data). Throw in the changes in Fed membership and leadership, and it is open season. (Barron’s).
- The end of QE. Those who were wrong about QE effects (hyperinflation) and attributed stronger equity markets to Fed policy are now taking the other side. This gives them a chance to be wrong in both directions!
- Debt.
Global. Now at $164 trillion, 225% of global GDP. (Timothy Taylor)

- US government debt. It is growing rapidly, and the pace cannot be sustained.
- The pension time bomb. $400 trillion by 2050. (Visual Capitalist).
-
- Trump Administration policies, especially regarding trade.
And here are some sensible refutations.
- Yield curve.
Flat or inverted yield curves tell us something about:
Recessions – Inverted yield curves precede recessions although flat curves can last for a long time before becoming inverted or showing a recession signal. All recessions are preceded by inversions but not all inversions lead to recessions.
Fed behavior – Flattening and inverted yield curve are associated with tightening of Fed policy, but tightening does not mean that a market sell-off or recession is around the corner. The link between the beginning of the tightening cycle and the impact on financial markets is loose.
Term premium risk – Flat yield curves tell investors there is no compensation for taking duration risk. There is limited reason to take marginal duration risk. We find that flat curves signal future increases in yield. It is a negative signal for bonds.
Equity markets – Flatter yield curve do not mean lower stock returns. Flattening curves are not associated with market sell-offs.
If you do not understand the chart below, you should be especially careful about reading scary stories about the yield curve. It is more than the slope of the curve; it depends upon how it happens.

- Briefing.com emphasizes that the inversion is a leading indicator, and the lead time may be significant.

Brian Gilmartin takes a balanced approach, citing some (ahem) other good sources.
Bob Dieli continues to deliver the best analysis of the business cycle. His monthly report is chock-full of data, analysis, and even some humor – if you are willing to go with economist jokes. Here is his current business cycle rating. You will not agree. Please note that he has been correct while almost everyone else has been wrong. The current expansion could have years to run.

-
This analysis has helped me stay on the right side of the market for eight years. Serious investors and institutions should subscribe to his service. It is information and analysis you cannot get elsewhere. Those on a low budget get the benefit of the basic conclusion via the “C-Score” in the weekly indicator snapshot.
- Current conditions remain solid.
- The Capital Spectator analyzes the current state of the business cycle, replete with data and charts, suggesting “that the economy will continue to expand.”
- The Big Four update via Jill Mislinski is a great method to see the most important indicators at a glance.
As usual, I’ll save my personal conclusions and suggestions for today’s Final Thought.
Quant Corner
We follow some regular featured sources and the best other quant news from the week.
Risk Analysis
I have a rule for my investment clients. Think first about your risk. Only then should you consider possible rewards. I monitor many quantitative reports and highlight the best methods in this weekly update.
The Indicator Snapshot
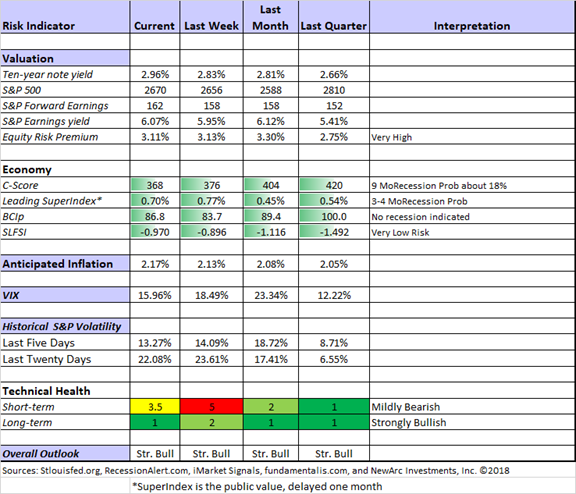
Short-term trading conditions improved significantly this week. In mildly bearish conditions our trading approaches can still be profitable, but that might not be true for everyone. We continue to monitor the technical health measures on a daily basis. The indicator did not drop low enough to take us out of the market in trading programs, but it was close.
The long-term fundamentals and outlook are little changed. The long-term technical health is back to strongly bullish.
The Featured Sources:
Bob Dieli: Business cycle analysis via the “C Score.
RecessionAlert: Strong quantitative indicators for both economic and market analysis.
Brian Gilmartin: All things earnings, for the overall market as well as many individual companies.
Georg Vrba: Business cycle indicator and market timing tools. None of Georg’s indicators signal recession.
Doug Short and Jill Mislinski: Regular updating of an array of indicators. Great charts and analysis.
Guests:
David Merkel explains why we should watch the thirty-year bond.
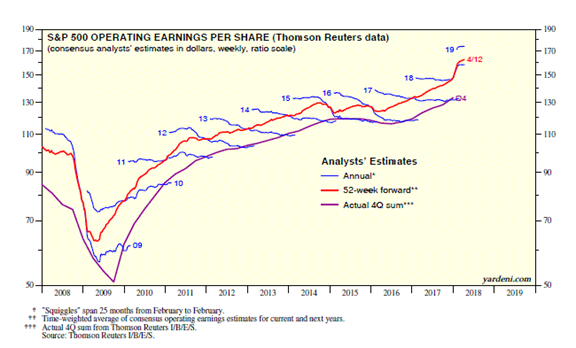
Dr. Ed Yardeni updates the forward earnings outlook.
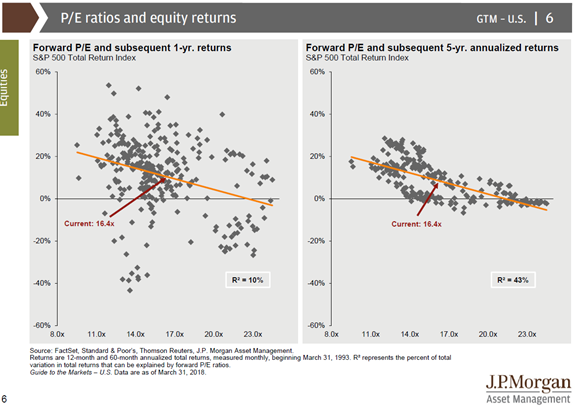
JP Morgan demonstrate how this translates into stock prospects for next year, and the next five years.
Insight for Traders
Check out our weekly Stock Exchange post. We combine links to important posts about trading, themes of current interest, and ideas from our trading models. This week we asked, “How do you filter out noisy trading signals?” As usual, we discussed some stock ideas and updated the ratings lists for Felix and Oscar, this week featuring the Russell 1000 stocks. Blue Harbinger has taken the lead role on this post, using information both from me and from the models. He is doing a great job, presenting a wealth of new ideas and information each week.
This week’s theme was inspired by yet another great post from Dr. Brett Steenbarger. He explains that traders need to start each day with an open mind and focus on the job at hand. This is also excellent advice for investors, who spend waste too much of their time on bombast and sensationalism. We all want to be informed and to make intelligent decisions, so picking our sources and focus is crucial.
Insight for Investors
Investors should have a long-term horizon. They can often exploit trading volatility! I remind investors of this each week, but now is the time to pay attention.
Best of the Week
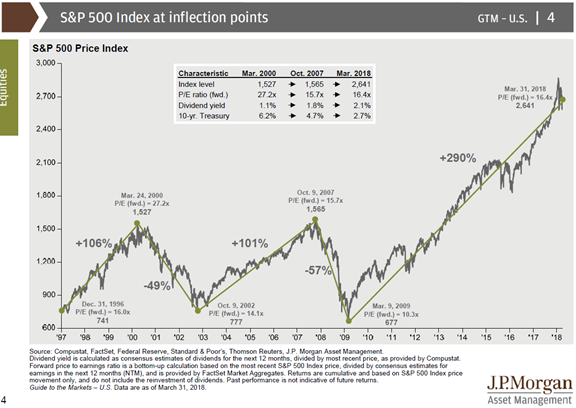
If I had to pick a single most important source for investors to read this week it would be J.P. Morgan Asset Management’s quarterly Guide to the Markets. All facts, all charts, and no argument. It is professionally prepared — a valuable resource which you can get for free. Anyone spending some time with this will learn something valuable. Here is one example.
I hope readers will use the comments to suggest other examples.
Runner-up for BOTW is Alan Steel’s tirade. He captures what I am trying to say here in fewer words, and much more colorfully.
He recounts the failed predictions about QE, the PIIGS, Japan, US budget decisions, the fiscal cliff and the Mayan Calendar.