
There is a normal economic calendar featuring four different housing reports. With little interest in recent economic or earnings news, the punditry has been interested in history. For many it is another opportunity to sell fear. The pundits might not change focus, but investors should have a resolution:
Quit fighting the last war!
Today’s WTWA will touch on a (mostly) overlooked element of the financial crisis. The Final Thought will emphasize what we all should be thinking about.
Last Week Recap
In my last edition of WTWA I noted the preponderance of inflation-related data and suggested that the week ahead might be an inflation watch. The idea was probably OK, but the inflation results were tame. Instead, the punditry found it more interesting to look back ten years on the fall of Lehman and the financial crisis. Whatever the current relevance, that made for good reading and watching, which I might well have guessed would happen. Did it have any effect on trading or investing? More below on that question.
The Story in One Chart
I always start my personal review of the week by looking at a great chart of the S&P 500. This week we’ll feature the futures chart from Investing.com. This is an interactive chart (if you go to the site) which provides many features. The static version still shows the overnight moves and provides a tag for each item of news.

The market gained 1.01% on the week, reversing last week. The weekly trading range was about 1.2%, still very low. I summarize actual and implied volatility each week in our Indicator Snapshot section below. Volatility remains well below the long-term average.
Personal Note
I will be taking a week off beginning next Saturday, so there will probably be no WTWA installment for the next two weeks. As I have done recently, I’ll try to do a mini-update if there is something really important.
Trivia Question
Who owns the Federal Reserve? Few know the answer, provided at the end of today’s post.
Noteworthy
Eddy Elfenbein has a “fun side project” determining the implied strength of NFL teams from the betting markets. He sees usefulness in this sort of exercise since these are a “close cousin” of financial markets. I strongly agree. Thinking about sports requires the same skills and forces you out of your existing market biases. It is a good way to learn about modeling and forecasting – strengths and weaknesses.
It might also reveal a different set of biases. Mrs. OldProf is an Eddy fan and follows him on Twitter (as do I, of course). She claims that there must be some error in his power ranking. Green Bay is only 7th!
The News
Each week I break down events into good and bad. For our purposes, “good” has two components. The news must be market friendly and better than expectations. I avoid using my personal preferences in evaluating news – and you should, too!
When relevant, I include expectations (E) and the prior reading (P).
The Good
- Rail traffic remains strong – especially Steven Hansen’s “economically intuitive” portions. (GEI).
- JOLTs showed continuing strength. David Templeton (HORAN) notes that job openings and quits are increasing faster than hires. (and please note – these numbers are about to be revised higher).

And the Washington Center for Equitable Growth updates the Beveridge Curve, also showing the recent strength.

- PPI was very tame, declining 0.1% E 0.2% P 0.0%
- CPI was in line on the headline number at +0.2% and lower on the core, 0.1% E 0.2% P 0.2%.
- High-frequency indicators improve. New Deal Democrat has the update on this valuable information. He divides the indicators into three groups, offering conclusions on each. This is the fastest method for those needing to take a real pulse of the economy to stay in tune.
- Initial jobless claims were only 204K, another new low.
- Bullish sentiment declines which is bullish on a contrarian basis. (Bespoke).

- US Homeowner equity tops $6 Trillion. This is a new record and represents $636 B in “tappable equity” than at the start of the year. Douglas A. McIntyre (24/7).
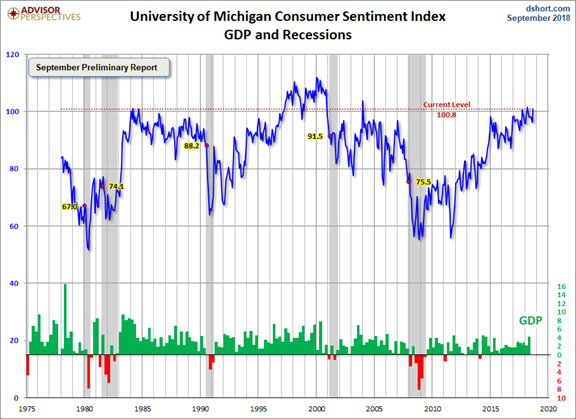
- Michigan sentiment registered 100.8 E 97 P 96.2. Jill Mislinski has the analysis and the great chart we have come to expect.
- NFIB small business optimism reached a new high, 108.8 P 107.9. David Templeton (HORAN) provides analysis of the components, as well as this chart.

The Bad
- Sea container movements slow. Steven Hansen (GEI) analyzes both the month-to-month and year-over-year weakness. Trade war effect?
- Retail sales gained only 0.1% E 0.4% P 0.7% revised up from 0.5%. (Bloomberg). Post Prime Day?

- Tariffs, more tariffs on China. Another $200 B according to late news reports.
The Ugly
Robinhood is supposed to be a no-commission broker, with special appeal to day-trading millennials. In fact, they are collecting ten times as much as other brokers for selling order flow. (Logan Kane).
Update on fake videos. I wrote about this in July. The story is now getting more traction, now recognized as a national security threat. (TechCrunch). To really understand the power, play this BuzzFeed News deep fake using former President Obama. He has recently said some aggressive things about President Trump, but not what is portrayed here!
The Week Ahead
We would all like to know the direction of the market in advance. Good luck with that! Second best is planning what to look for and how to react.
The Calendar
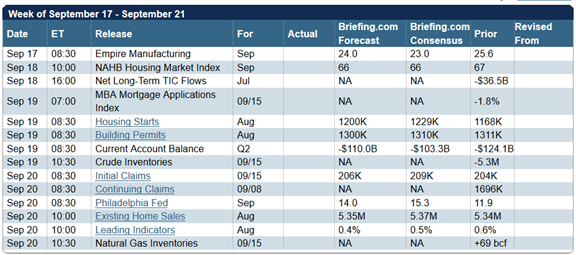
We have a normal economic calendar featuring housing news. Many will also be interested in the Philly Fed and Leading Indicator reports. As in recent weeks, we can expect trade war salvos and political news to be more important than earnings and the economy.
Briefing.com has a good U.S. economic calendar for the week (and many other good features which I monitor each day). Here are the main U.S. releases.
Next Week’s Theme
There is some economic news, but in recent weeks the focus has been elsewhere. In normal times we could expect plenty of attention to housing with four relevant reports on the docket. Instead, expect a grudging turn from the ten-year Lehman anniversary to lessons for the future. Pundits might not, but investors should be asking:
How relevant is the financial crisis to the current market? What can we do to prepare for the “next war?”
The lessons
The biggest problem in drawing lessons from history is the temptation to fight the last war. In 2014 Ben Carlson had a nice post on this topic, including suggestions for further reading and the following key section:
One of my favorite expressions about the behavior of investors is that we are constantly fighting the last war. The representative heuristic causes us to overweight recent events when we make forecasts and extrapolate the latest performance indefinitely into the future.
The reason it’s so easy to fall prey to this bias is because in the back of our minds it’s very easy to think, “If this same market scenario happens again I will be prepared and I know exactly how to position my portfolio. I will not get caught off-guard again.”
Barry Ritholtz notes 10 things that people still get wrong about the crisis (Bloomberg).
The ten-year anniversary of the fall of Lehman, and the start of the financial crisis, launched a raft of retrospective articles. Most were heavy on the author’s pet interpretation of what happened and light on useful ideas about the future. Some examples:
- Nothing has changed. It could all happen again tomorrow. (Economics has not advanced in the right ways, Larry Summers).
- Policymakers did well, given the circumstances. (Neil Irwin, NYT)
- Subprime lending has been replaced by…..(fill in the blank). (Various pundits on MarketWatch).
- Bank regulation has not improved.
- No one went to jail, so there is no deterrent against a repeat. (Ritholtz).
- Debt of all types is massive, and so is leverage.
These themes were especially popular among those warning current equity investors.
An important theme that got little attention was the role of an accounting rule called “FAS 157.” This new rule changed the valuation method for some bank assets. Michael Cannivet’s excellent summary notes that this was a ticking time bomb that provided a tipping point for the crisis. This chart illustrates the timing.

Ken Fisher writes that Lehman was “illiquid, not insolvent.” He quotes former FDIC head William Isaac as saying this mushroomed several hundred billion in loan losses into $2 trillion in write downs. The accounting rule was eventually modified, but the effect on investors was lasting.
The widely bandied risks of today’s bull market don’t compare. Investors fight the last war psychologically. Markets don’t. The next bear will likely look more normal, starting amid investor euphoria.
Robert Pozen (Harvard Business Review) asks whether it is fair to blame FAS 157 for the crisis. He analyzes several myths about this issue, noting that part of the problem was poor understanding (by banks, counterparties, and investors) on what the rules actually meant.
I wrote extensively about this problem as it was happening, but I was wrong about this prediction:
This is something you have not seen anywhere else. In a few weeks, you will see it everywhere. There is general consensus that the credit default swap market is flawed, unregulated, and possibly manipulated.
No one seems to have noticed that the ABX, the Market Index used to shrink the financial balance sheets and drive ratings downgrades, consists of only twenty securities — all credit default swaps.
Connect the dots….
Do you think that these CDS’s might have been manipulated by those seeking short sale profits on financial firms? At some point we will see that the “marks” used by accountants were not only illiquid securities, but possibly manipulated securities. If there is ever an SEC investigation, we will see some “perp walks.”
You heard it here first.
That was a bad guess. I continue to believe that there was a market ju-jitsu. Clever traders attacked the ABX (requiring far less capital to drive down the twenty underlying MBS holdings) to profit from short positions in banks and the overall market. It would make a fine dissertation topic.
What has changed
There actually have been several changes, including the following:
- Modification and clarification of the FAS 157 rule.
- Tighter bank regulation and the addition of stress testing.
- Reduction of permitted leverage.
- Increased reporting of swaps.
But more could and should be done.
In today’s Final Thought, I’ll focus on the next war.
Quant Corner
We follow some regular featured sources and the best other quant news from the week.
Risk Analysis
I have a rule for my investment clients. Think first about your risk. Only then should you consider possible rewards. I monitor many quantitative reports and highlight the best methods in this weekly update.
The Indicator Snapshot

Short-term trading conditions continue at highly favorable levels. Actual volatility remains very low. While many argue that the low VIX level is a sign of complacency, it remains higher than realized volatility. Those selling volatility and making money. The 3% yield is slightly rounded up. 3% is still viewed as a battleground on the ten-year note.
The request for a 2008 version of the Indicator Snapshot was a great idea. The problem is that we need more dates. The key warnings came in 2006 or 2007. By 2008 the C-Score was (correctly) looking for the cycle trough. My plan is a separate article with a couple of past time frames and then a regular link from WTWA.
The Featured Sources:
Bob Dieli: Business cycle analysis via the “C Score.
Brian Gilmartin: All things earnings, for the overall market as well as many individual companies.
RecessionAlert: Strong quantitative indicators for both economic and market analysis.
Georg Vrba: Business cycle indicator and market timing tools. None of Georg’s indicators signal recession. Here is the latest chart on the Business Cycle Index.
Doug Short and Jill Mislinski: Regular updating of an array of indicators. Great charts and analysis.
Guest Commentary
Tom Lawler, via Calculated Risk, looks at the difficulty in estimating the number of US households. It would seem to be so easy, but….
To be sure, there is no shortage of household estimates: in addition to the decennial Census counts, Census releases four different estimates of the number of US households. Unfortunately, the estimates not only differ materially, but also show different characteristics of households (e.g., by age) and often show different growth rates over time.

Insight for Traders
Check out our weekly Stock Exchange post. We combine links to important posts about trading, themes of current interest, and ideas from our trading models. This week we took note of the widespread discussion of the most recent appearance of the Hindenburg Omen. Each time this appears it attracts a new raft of adherents with little discussion of past results. We took a deeper look. We shared advice by top trading experts and discussed some recent picks from our trading models. Our ringleader and editor, Blue Harbinger, provided fundamental counterpoint for the models, who are all of the technical persuasion.
We have been getting good results from the models. Some of them fit a risk/reward profile that is attractive for retirement investors. Check out the weekly post (including results) and write to us at main at newarc dot com if you want more information or a consultation.
Insight for Investors
Investors should have a long-term horizon. They can often exploit trading volatility.
Best of the Week
If I had to pick a single most important source for investors to read this week it would be Jack Forehand’s (Validea) The Benefits of the Other Side. He takes note of the increasing polarization in society and the spread from politics to other ideas.
The belief that there is an absolute right answer and an absolute wrong one is fraught with problems, though. It leads to not even considering the opinions of others. It becomes the enemy of learning. And it leads to poor decision making.
We all are subject to this. We like to point our fingers at others, but they are often best pointed in the mirror.
He proceeds to consider several historical metrics that “should be open to review and subject to challenge.”
In the end, looking at the other side doesn’t mean you have to change what you think. It doesn’t mean you need to ignore the historical evidence that supports what you think. What it means is that confirmation bias can be the enemy of good decision making. We all want to be right, but it is more important to be correct.
This is great advice.
Stock Ideas
Chuck Carnevale has a great lesson about the importance of considering valuation in companies you love. His examples include “the two best utilities in America.”
Brad Thomas identifies 12 “moat-worthy” REITs.
Semiconductors and Equipment are at the bottom of sector relative strength. Bespoke provides charts, but you must answer for yourself whether this is an opportunity. (I like it).

Stone Fox Capital sees Advanced Micro Devices (NASDAQ:AMD) at the end of the current growth cycle, but still suggests “letting it run.”
Investing Methods
Lawrence Hamtil has an interesting discussion of the factors behind Peter Lynch’s storied success, a return almost double that of the S&P 500 for 13 years. He identifies Lynch’s flexibility in his “charter.” He had the ability to exploit the best ideas from colleagues running more focused funds.
Personal Finance
Seeking Alpha Senior Editor Gil Weinreich’s Asset Allocation Daily is consistently both interesting and informative. This week I especially liked his discussion of the possible limits of diversification and how best to achieve it. His carefully reasoned answer considers several different dimensions of diversification. He cites a strong post by Erik Conley, asking us to challenge ourselves. What investment approach is best, not for everyone, but for a specific investor? He discusses the difficulties of implementing a “buy and hold” approach. He writes, “Everybody is a Buy & Hold investor until their account value starts going down.”
Abnormal Returns is an important daily source for all of us following investment news. His Wednesday Personal Finance Post is especially helpful for individual investors. As always, there are many great links on various topics. I especially liked Ben Carlson’s Avoiding a Single Point of Financial Failure. It includes, for example, advice from Charlie Munger: There are 3 ways for a smart person to go broke: liquor, ladies, and leverage. And the important observation that financial “emergencies” are just infrequent expenses you can reliably expect to see, you just don’t know when. Read the full post for some other great advice.
Watch out for…
Some BDCs. There are some that are OK, says Tim Plaehn, but trading at a discount to book value is a (somewhat counterintuitive) negative. There is no path to growth the portfolio, leading to a death spiral. He provides three examples.
Some wide-moat stocks? What is this? A wide moat is supposed to be good. Susan Dziubinski (Morningstar) identifies why valuation matters as well. She provides seven examples. Phew! I don’t own any of them. Do you?
Junk bonds. James Picerno explains why it might be time to take some profits.
Final Thought
How can we best prepare for upcoming investment challenges? How can we fight the next war rather than relive the financial crisis?
In an era where tweets and political events dominate the market agenda, this seems like a special challenge. We need focus. With that in mind, I will try for simplicity.
The most important issue is avoiding a global trade war.
How this is achieved does not matter. Some see a grand Presidential plan where a bargaining position has been established. Others see impulsive positions that must then be walked back or negotiated. It does not matter which is correct, or whether either is correct. As investors we care about the result, not the politics. A credible sign of real progress could lead to a 4% jump in stocks; a real solution might mean as much as 10%. There is no way to prepare for a surprise announcement. Would you buy the market after a four percent pop? I didn’t think so.
- The most recent estimate of the effect on global GDP is about a 1% hit.
- The estimate of the impact on S&P earnings is about $10, a decline of 6% from current levels. Some of this is already reflected in the market.
- There is a danger that the stock market effect of the tax cuts will be completely undone.
Here are three simple steps.
- Get past the hype and understand the economics. My colleague Dr. Merton D. Finkler has an unbiased presentation of the issue, showing the effects on US agricultural exporters and Harley Davidson. The help to 140K steel workers should be compared to the impact on 6.5M jobs negatively affected.
- Judge positive progress by news that traditional Republican groups and leaders are carry an effective message. (Bloomberg).
- Watch for a decline in business confidence and consumer sentiment. David Templeton (HORAN).
For the moment, the delicate balance continues.
Our thoughts are with our many friends in Florence-affected areas.
[Are you ready for the challenges ahead? Worried about the pitfalls? Can’t get back into the market? Need more income? Our no-cost portfolio analysis is on hold during my vacation, but you can get on the calendar for early October. Just email invested in some safe but stodgy stocks – so called value traps? We generate extra yield from such positions by selling near-term calls. If you need more income, you might want to get our free description of this method. For this or a free portfolio analysis just email main at newarc dot com].
Trivia Answer
From the Atlanta Fed’s Charles Davidson via GEI, where John constantly provides items you would otherwise miss.
Stop us if you’ve heard this one: the Fed is owned by a small, influential clique of global oligarchs whose aim is to serve powerful financial interests.
As Federal Reserve employees, we frequently encounter this misconception. And we are always eager to dispel it. The truth is, the Federal Reserve was established to serve the public interest and is not owned by anyone. See the full post for a complete explanation of both history and current operation.
I’m more worried about:
- Emerging market economies and their debt. Good comments from Eddy Elfenbein (who also has a great update of his portfolio for owners – like me – of his CWS ETF and many other followers.
I’m less worried about:
- Artificial intelligence effects on jobs. Two skeptical views of this “problem” from Bret Swanson (AEI).