Last week I wrote that there was so much on the calendar that it was impossible to choose a single theme. This week presents the opposite problem. In the wake of the big news, what will command attention? As I studied the data, I was struck by the confluence of record results. Put that together with record stock prices, and there is a natural question for the ever-skeptical punditry:
Is this as good as it gets?
Last Week Recap
In the last edition of WTWA I predicted a paradise for the punditry, gorging on a feast of data, Fed news, and policy proposals. That was a pretty easy call, and it did give us a chance to think about a range of key issues. I noted that a lot of news does not necessarily translate into volatility – and so it was. The market shrugged off the appointment of a new Fed Chair, Mueller’s indictments, and the GOP tax proposal. The economic data was mixed, and so was the market.
The Story in One Chart
I always start my personal review of the week by looking at this great chart of the S&P 500 from Doug Short via Jill Mislinski. She notes the gain of 0.26% on the week, after Friday’s strength. Once again, it was a week of very low volatility; the intra-week range was less than 1%. Historically 1% moves are commonplace — each day!
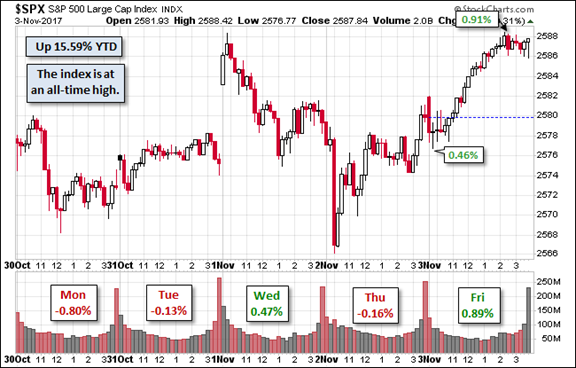
Doug has a special knack for pulling together all the relevant information. His charts save more than a thousand words! Read the entire post for several more charts providing long-term perspective, including the size and frequency of drawdowns.
The News
Each week I break down events into good and bad. For our purposes, “good” has two components. The news must be market friendly and better than expectations. I avoid using my personal preferences in evaluating news – and you should, too!
The economic news has been mostly positive, as summarized by New Deal Democrat’s list of long, short, and coincident indicators.
The Good
- Lumber futures are stronger. Mark Hulbert navigates the complexities of trends and tariffs, concluding that this is a useful leading indicator for stocks.
- Auto sales continued a “hot streak” (WSJ). The SAAR is now 18.1 million, with good prospects for the end of 2017.
- Jerome Powell’s nomination as Fed Chair was quietly accepted by markets. With New York Fed President William Dudley reportedly about to announce his retirement, there are four more openings to fill.
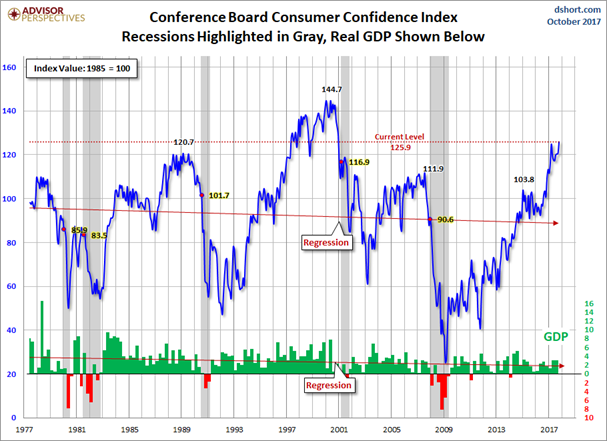
- Consumer confidence measured by the Conference Board is at the highest level in 17 years. Jill Mislinski’s analysis is comprehensive and the summary chart is great. Bespoke’s charts show that future confidence is lower than the present.
- Earnings reports remained strong (FactSet) with earning beat rates 4.8% higher than average and revenue beat rates 1.2% higher. Bespoke has a nice summary of the biggest winners and losers.
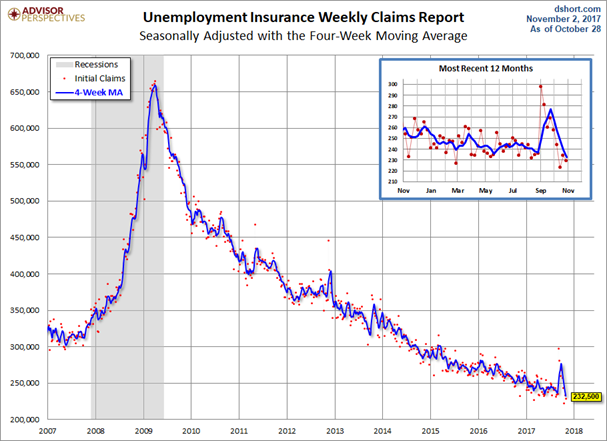
- Initial jobless claims hit the lowest level since 1973 (four-week moving average). Once again, let us look at Jill Mislinski’s informative chart. It helpfully shows the long-term view, but with a focus on the last year.
The Bad
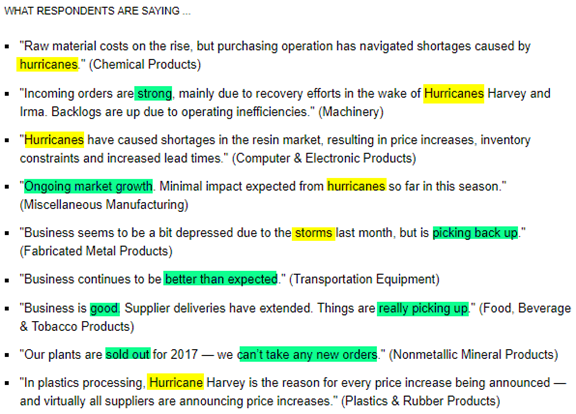
- ISM manufacturing is cooling from a hot September reports Bespoke. The decline to 58.7 from last month’s thirteen-year high is “modest” they suggest. They are also encouraged by the comments:
- The rally is somewhat narrow. Lara Crigger (ETF.com) describes the presence of the “Four Horseman” in many ETFs. The heavy weighting of these stocks can generate an exaggerated impression of overall strength.
- The employment news. While the report was mixed, the headline number missed expectations, so I’ll score this as “bad.”
- PBS highlights the lower labor force participation and lack of wage growth, up only 2.4% over the last year.
- The miss in the headline number was much smaller when considering upward revisions to the prior months.
- ADP private job growth was solid. (James Picerno)
- New Deal Democrat summarizes the data and reaches the following conclusion:
This was an excellent report in terms of labor utilization, decent in terms of jobs growth, and poor in terms of wages.
The big declines in unemployment, underemployment, involuntary part time employment, and persons who want a job now but haven’t looked have nudged us very close to what has been “full employment” in the past two expansions. We may be as little as 1.5 million jobs away.
The Neutral
This week had some news worth mentioning, but without a real market effect.
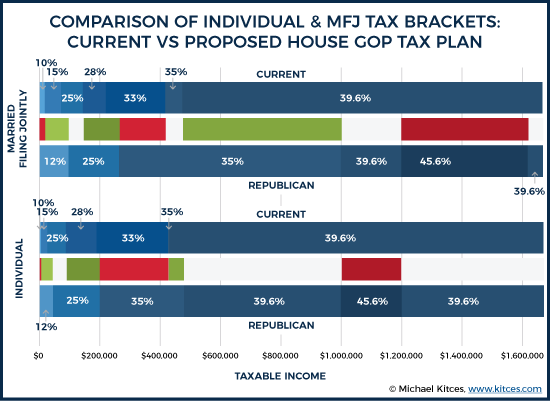
- The GOP tax reform proposal. I have predicted that this would have no market effect, and that proved true this week. The original proposal sparked hundreds of articles on who would benefit from each provision. This is a necessary process, of course, because information is needed before deciding. That said, the proposal is not close to mustering a Congressional majority. Michael Kitces has a nice, detailed review of the proposal. It includes the summary table below. If you see yourself has getting a tax reduction, what should you do? I consulted Mrs. OldProf, who tracks issues like this with care (although not as much as used following the Packers). Her recommendation: Do not spend the tax reform money just yet!
The Ugly
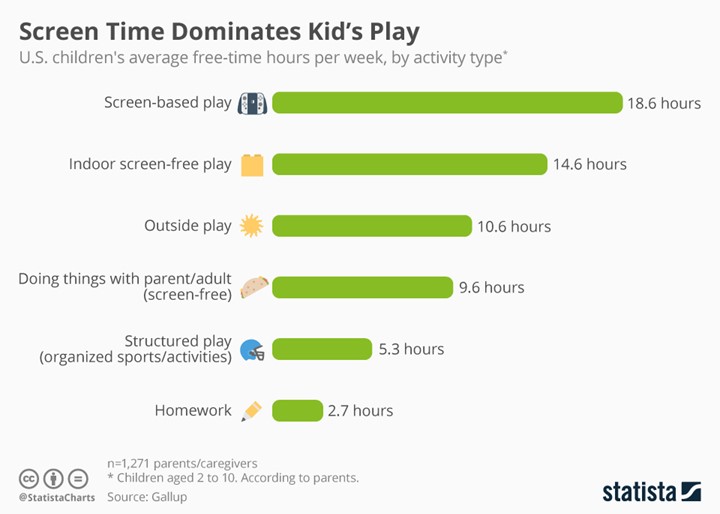
Kids’ play time is overwhelming geared to screens. 18.6 hours per week and 2.7 on homework?
The Week Ahead
We would all like to know the direction of the market in advance. Good luck with that! Second best is planning what to look for and how to react.
The Calendar
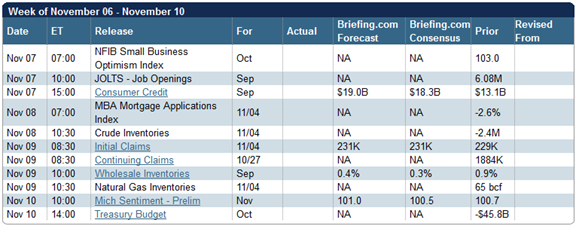
We have a very light data calendar. The JOLTS report is interesting to wonks, but usually spun into an inferior read on job growth. The President’s Asia trip will capture the news, but few would venture a guess about the market effect. We are past the peak of the earnings season, but some important news remains.
Briefing.com has a good U.S. economic calendar for the week (and many other good features which I monitor each day). Here are the main U.S. releases.
Next Week’s Theme
With little on the calendar and so much space and time to fill for the financial media, what will be the focus next week. It is the opposite of last week, when there were many possibilities. As I was preparing the updates on data, I noticed that many economic indicators are reaching record levels – right along with stocks.
I suspect that this will be fertile ground for discussion next week. Since the financial punditry always must dig deeper, I expect to hear the question – Is this as good as it gets?
Here are some perspectives, in my customary bearish to bullish range.
- Yes. Some of these levels just cannot get much better. Unemployment claims, unemployment, consumer confidence and the VIX are good examples. And of course, the over-valued stock market will follow when these measures roll over.
- Maybe. The pros and the individual investors disagree. (David Templeton of HORAN). The interesting charts show that bearish individual sentiment at the end of August coincided with the next leg of a rally. The active manager exposure index has declined from 71.7% to 60.2%, but this is viewed as a slightly lagging or concurrent indicator.
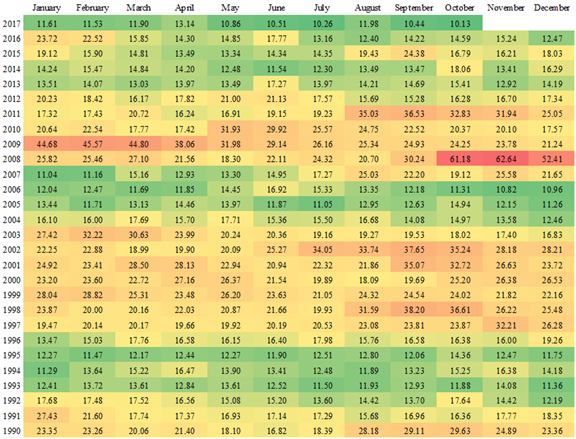
- Eventually. Volatility is at a record low. Fund manager Ploutos provides an interesting analysis of historical VIX readings, with this conclusion:
What did I take away from this study? Equity volatility does not change from ultra-low to high overnight. With equity volatility historically low, do not expect a sharp economic or financial market correction absent some exogenous shock. While equity multiples in the U.S. continue to be historically extended, we could continue to see low volatility and rising stock prices over the next 12 months. When equity volatility persists at an above-average rate for an extended period of time – as it did in 1999 and late 2007 and early 2008 – it may be time to pare your risk and accumulate dry powder for a correction.
- Not yet. The record earnings expectations march higher, and the stock multiple has not caught up. (Brian Gilmartin).
- Good is good. Do not second-guess the obvious. The Fear and Greed Trader wisely notes the need for advance planning followed by calm execution. He reaches a conclusion like Urban Carmel’s:
So the first myth that needs to be abolished is that one won’t have the time to get out before the next crash. Not true, the 2007/2008 financial crisis is the first example showing that to be the case. Anyone care to point out a more dire time in equity market history?
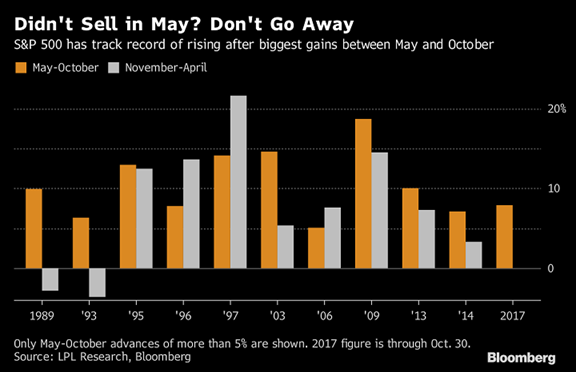
- The best is yet ahead. Barry Ritholtz notes that “sell in May” missed s 7.9% gain. He cites LPL’s Ryan Detrick who showed that such contra-seasonality gains have nearly always been associated with a further rally in the next six months.
- Maybe a lot higher. “Davidson,” who has been very accurate throughout the rally, analyzes economic fundamentals, reaching the following conclusion in what Todd Sullivan calls “some of his best work”:
Economic indicators provide investment signals well before investor market psychology begins to shift. Investors remain decently pessimistic while economic indicators forecast continued economic growth and higher profits. As more investors turn optimistic, markets should continue to rise higher. I expect markets to rise as long as the T-Bill/10yr Treasury rate spread remains favorable. One cannot predict how high. One can only discuss the potential. The SP500 in 3yrs+ has the potential to reach $3,500-$4,500. A wide range and over-valued, but it is impossible to predict how optimistic market psychology can become. For now, the best one can do is to simply say “higher”.
The cutoff point for equity investing will be in my opinion the T-Bill/10yr Treasury rate spread narrowing to 0.20%. At 1.35% today, we have 2yrs-3yrs of higher equity markets ahead in my opinion.
As usual, I’ll have more in the Final Thought, where I always emphasize my own conclusions. In this case, it includes what I see as most important.
Quant Corner
We follow some regular featured sources and the best other quant news from the week.
Risk Analysis
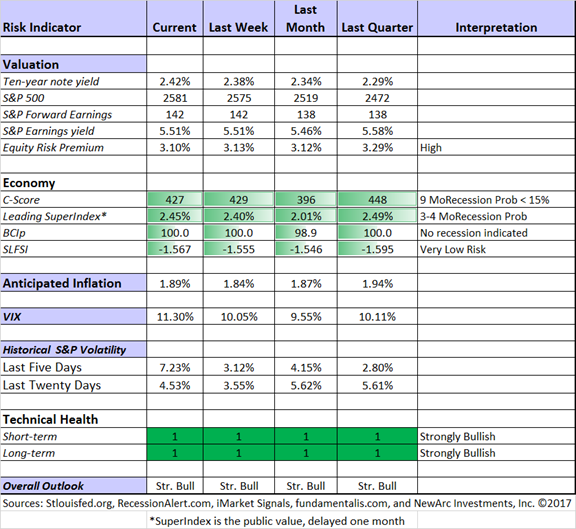
I have a rule for my investment clients. Think first about your risk. Only then should you consider possible rewards. I monitor many quantitative reports and highlight the best methods in this weekly update.
The Indicator Snapshot
The Featured Sources:
Bob Dieli: Business cycle analysis via the “C Score.
RecessionAlert: Strong quantitative indicators for both economic and market analysis.
Brian Gilmartin: All things earnings, for the overall market as well as many individual companies.
Georg Vrba: Business cycle indicator and market timing tools. This week Georg suggests a method for improving the popular Shiller CAPE valuation indicator. A key is that he takes a 35-year moving average to include multiple business cycles and smooth the effects of changes in earnings reporting. This is an interesting approach, but it does not leave very many cases of signals. Quants will really love this article.
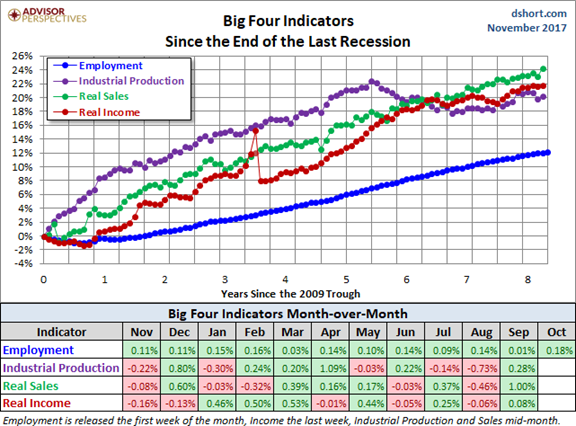
Doug Short: Regular updating of an array of indicators. Great charts and analysis. With all the recent data, it is time for another look at the Big Four indicators most relevant for recession dating. (via Jill Mislinski).
Guest Sources:
Urban Carmel joins the many who see the near-term recession risk as low. Check out his chart-filled post for details.
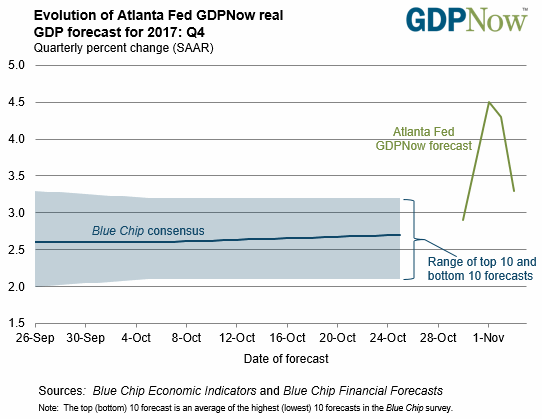
Want to know more about the Atlanta Fed’s GDP Now program? Here is a link to a podcast interview with Pat Higgins, a policy adviser and economist who created the tool. Let’s also look at the most recent forecast for Q417.
Insight for Traders
We have not quit our discussion of trading ideas. The weekly Stock Exchange column is bigger and better than ever. We combine links to trading articles, topical themes, and ideas from our trading models. This week’s post is about the advantage of diversity when a pullback is threatened. To illustrate, we provided some historical data on the trading models. And of course, there are updated ratings lists for Felix and Oscar, this week featuring small caps. Blue Harbinger has taken the lead role on this post, using information from me and from the models. He is doing a great job.
Insight for Investors
Investors should have a long-term horizon. They can often exploit trading volatility!
Best of the Week
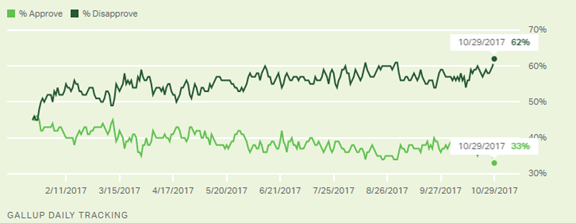
If I had to pick a single most important source for investors to read this week it would be Bespoke’s brief and sharp take on politics and investing. As usual, they make their argument with charts. In this case, the topic should be familiar to WTWA readers: Don’t mix political opinions and investing. I maintain that understanding likely policy outcomes will improve investment results. Some readers confuse this with political advocacy. Sometimes the policy issues matter to the market, and we should all pay attention.
Bespoke provides two excellent charts, the first showing President Trumps plummeting approval rating.
The second shows approval ratings and the stock market during the Trump administration.
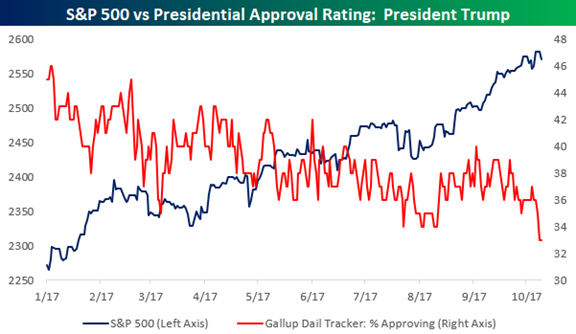
This is like the early response to President Obama. We must monitor events, but do so without getting political passions involved.
Stock Ideas
David Fish updates his list of dividend champions and contenders for November.
Financial engineering? An activist investor looks deeply into the debate over Restoration Hardware (NYSE:RH), suspecting a near-term spike higher.
Want to participate in the bot revolution? Here are two ETFs to consider.
Simply Safe Dividends analyzes AT&T (NYSE:T) asking whether this high-yielding dividend aristocrat is a value trap. (I don’t think so, but selling near-term calls against stocks like this is a winning long-term strategy).
Lee Jackson (24/7) highlights four dividend stocks recommended by UBS.
Electric vehicles and Nickel?
Personal Finance
Seeking Alpha Senior Editor Gil Weinreich has an interesting topic every day. His own commentary adds insight and ties together key current articles. As usual this week he had several good articles, but my favorite this week discusses takes up the question of whether retirees should use a “bucketing” approach or treat assets as a unitary portfolio. He cites a provocative post by investment manager Ron Surz.
Alan Steel (HNW Magazine) has a witty analysis of the many predictions of Albert Edwards. Look at the article titles as well as the publications featuring his viewpoints.
Abnormal Returns is always interesting, but the Wednesday edition is especially geared to individual investors. My favorite this week raises the 3 great misconceptions about retirement saving.
Suze Orman says you should not retire until you are 70. Walter Updegrave (Money) disagrees.
Watch out for….
Morningstar ratings. Those stars describe history. Not so good at helping you think about the future. (WSJ)
Unproven claims that marijuana can cure cancer (FDA). If that does not matter to you, here are the fifteen states most likely to legalize the drug. Gallup reports than 64% of Americans support legalization for recreational use.
Final Thoughts
Can we expect to identify market tops from the record strength in economic indicators? No.
This is one of the most deceptive practices, and sadly, a common one. Writers who are perpetually bearish (or bullish) will interpret data in a straightforward fashion when it suits their purpose. When it does not, the predict something like “the sunset always follows the sunrise.” I call this the Chauncey Gardiner approach. It is just as naive as it is in the movie, and verges on intellectual dishonesty. If I seem unusually exercised by this topic, you are reading me right!
When indicators and markets finally roll over and get worse, we will be able to look back and spot the “top.” That is much different from a real-time forecast. The current level of economic strength can continue or improve – perhaps for years. Many pounce on the first decline in an indicator and leap to an unwarranted conclusion.
This is not just a bearish trait. When the market was reaching new lows in 2008, the same argument was made by bulls, including Mr. Buffett. How long can things go? Buy when there is fear. These comments were right, but it took several months. While a relatively short time on a historical stock chart, it seemed like an eternity to investors as markets declined much further.
Trying to guess the top (or bottom) from improving (or worsening) indicators is a fool’s errand.
Stocks are driven by earnings and interest rate expectations. These factors remain favorable, as I record each week. We have no special threats to financial stability, and plenty of fear built into the market. I also expect the “slower” economic indicators to follow the “soft” data that many try to dismiss.
Monitoring these factors is one of the prime missions of WTWA.
What worries me…
- Mueller indictments and President Trump’s response. This is still on my list. The first indictments showed an inclination to move up a chain of possible offenders. If a Trump family member is included and the President fires Mueller, the Nixon-era Saturday Night Massacre comparisons will get headlines. N.B., I refer not to the substance of the issue, but to the market reaction.
- The Asian trip. I wish the President had more willingness to use expert advice. With important trade and security matters at stake, it is an opportunity to improve some ties with needed allies.
…and what doesn’t
- Stock valuation. Since I regard the most popular levels as flawed, I focus on expected earnings and alternative opportunities. While some individual stocks seem richly valued, I am having little trouble finding attractive choices.
- Low VIX readings. The so-called “fear gauge” is low because actual trading volatility is low. Again, this is something we document each week. If you have been trading on an expected increase in the “fear gauge” you have been losing.
