The economic calendar is normal, with a holiday-shortened week and some ongoing political worries. Competing with the Washington Circus will be Q417 corporate earnings reports. The former topics will have greater news interest, but investors should be digging into the earnings reports. The earnings story is always a tasty stew – expectations, results, differing measures, revenues, and future expectations. The tasters are free to report their impressions. Sound benchmarks are elusive. This season has an extra ingredient – the tax cut effects. I expect the punditry to be looking ahead, and asking:
How should investors interpret Q4 earnings updates?
Last Week Recap
In the last edition of WTWA I expected a focus on inflation effects. While that generated some attention and headlines, the modest PPI and CPI reports stilled any imminent worries. Many sell-side firms and columnists continued to describe their worries for 2018, our theme of the last two weeks.
The Story in One Chart
I always start my personal review of the week by looking at a great chart. I especially like the Doug Short design with Jill Mislinski updates and commentary. You can see many important features in a single look. She notes the new records along with other indicators. The entire post is well worth reading for the collection of charts and analytical observations.
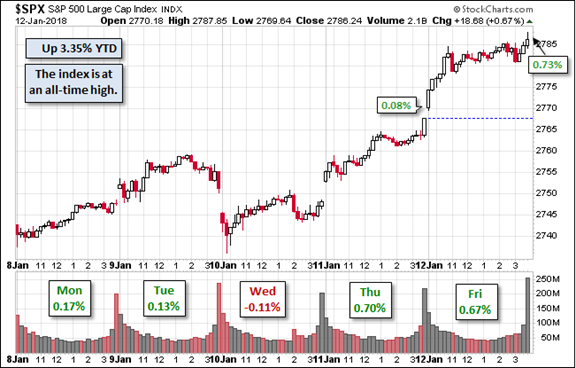
The trading range for the week was about 2%, below last week’s 2.6%, but higher than in recent months.
The News
Each week I break down events into good and bad. For our purposes, “good” has two components. The news must be market friendly and better than expectations. I avoid using my personal preferences in evaluating news – and you should, too!
The economic news was good. Before the inflation numbers I published a guide to assist interpretation. Many seemed to find it useful, and one of my plans for the new year is to more analysis of economic indicators.
The Good
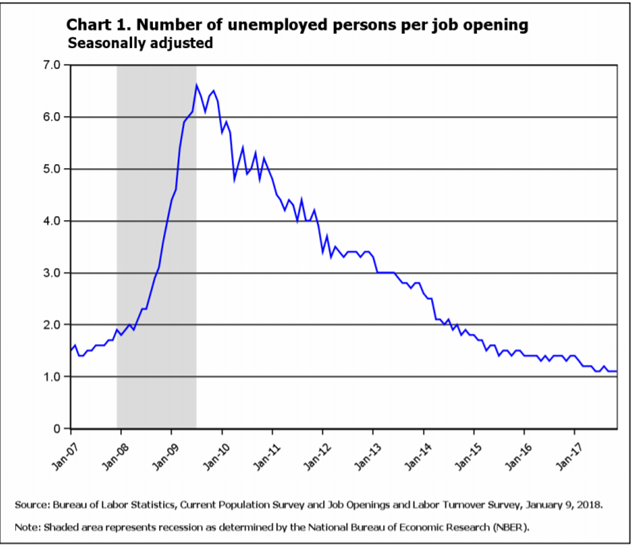
- JOLTs was another positive report. As usual, none of those (even my best sources) did a good job on this release. It is NOT a good source for overall net jobs growth. The monthly employment situation report is better designed and timelier for this purpose. This is a typical case of taking the subject of greatest interest and citing anything that might be relevant.
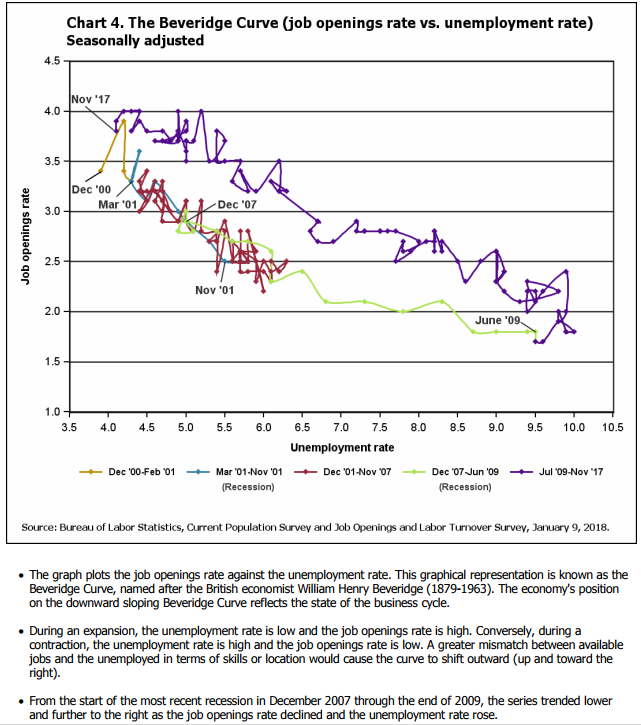
The significance of JOLTs is labor market structure. It tells us about shortages, mismatches, and the business cycle. The voluntary quit rate is a sign of confidence by current employees. The openings to unemployment rate is a key measure of labor market tightness. The Beveridge curve interprets the data in the most useful way. I continue to be disappointed that no one covers this report in the most informative fashion.
- PPI Headline and core PPI were both -0.1%, far below expectations and the prior month. Some observers see this as a negative, since it is below the 2% Fed target. That target is designed to reflect a reasonable level when there is suitable growth. If we are getting good growth with lower inflation, that is a positive.
- CPI registered a headline increase of 0.1%, below expectations, while the core was up 0.3%. The core was up 1.8% on a year-over-year basis. The fixation on a single reading that might exceed 2% is misguided.
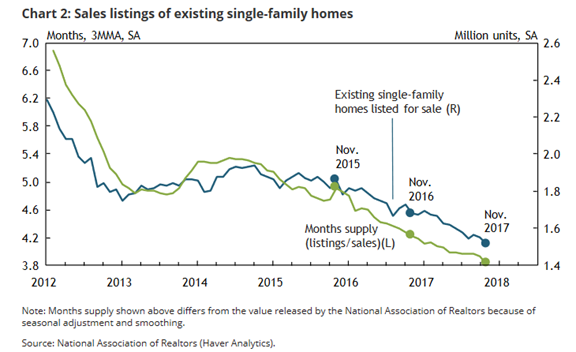
- Pent-up demand for Housing according to the KC Fed, via Calculated Risk.
- Inventories increased to 0.8% on wholesale goods and 0.4% for businesses. Both numbers were higher than expectations and big increases over the prior month. Inventories are a favorite target for pundits. Bulls claim that businesses are stocking up for anticipated demand. Bears say that they are stuck with unwanted goods. How can one tell? New Deal Democrat, in his fine weekly compilation of high-frequency indicators, suggests the following:
November data included business inventories, which increased slightly at all levels, but were outpaced by strong sales, meaning that the inventory to sales ratio declined to a 2.5 year low.
The Bad
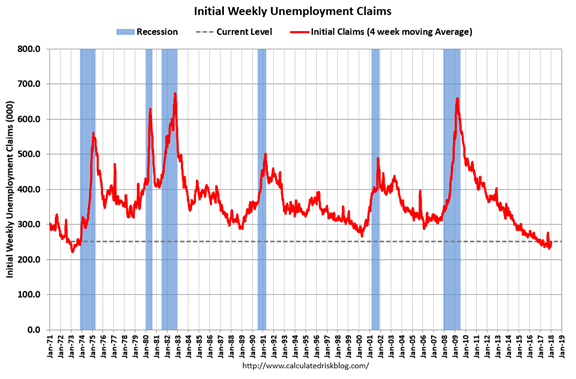
- Initial Claims rose to 261K, above expectations of 248K and the prior week’s 250K. (Calculated Risk).
- NFIB Small Business optimism dropped from 107.5 to 104.9.
- Framing lumber prices up sharply, 22% with CME future more than double that rate.
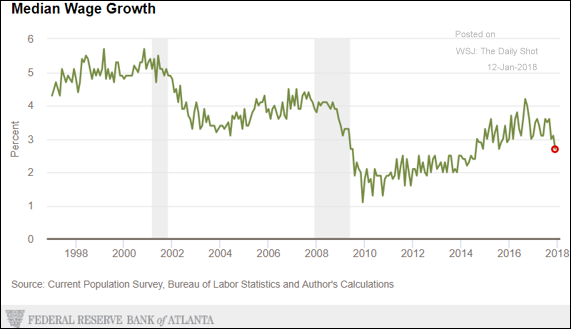
- Wage growth still lagging Atlanta Fed via The Daily Shot.
The Ugly
The Hawaiian false alarm. We now know that it was caused, at least partially, by one person “pushing the wrong button.” There is a sophisticated detection system, reports CNN.
The detection triggers an instant Strategic Command, or STRATCOM, assessment process. The assessment looks at where the launch is, the potential type of missile, trajectory, apogee, distance and potential targets in the path of the missile.
Top military commanders join a conference call, with the top priority being to decide whether the missile is a threat to the US or its allies.
If the missile is a threat, the president is brought in and response decisions are made. NORAD (the North American Aerospace Defense Command), STRATCOM, intelligence agencies and the National Security Council are involved in the decision-making.
The many affected people did not get a correction for 38 minutes as they gathered, wept, and prayed with family and friends. Like me, some were probably reminded of this iconic image of Slim Pickens:
Noteworthy
Are you smarter than a Dolphin? You will enjoy the fascinating story of Mississippi resident (Institute of Marine Mammal Studies), Kelly the Dolphin, who has taught other dolphins and “trained the humans.”
The Week Ahead
We would all like to know the direction of the market in advance. Good luck with that! Second best is planning what to look for and how to react.
The Calendar
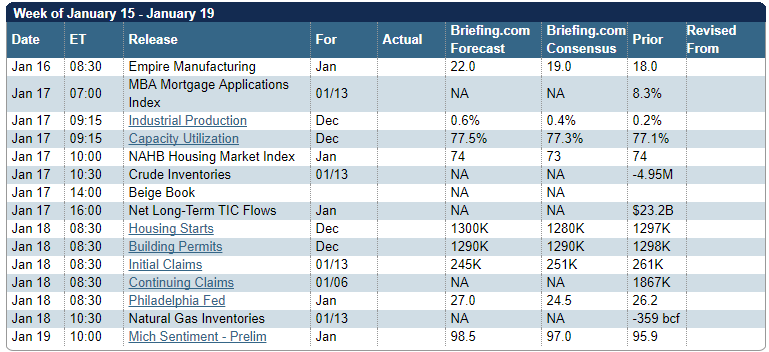
We have a normal economic calendar, but a holiday-shortened week. The housing data is most important, and Michigan sentiment is also of interest. FedSpeak and the Beige Book will provide an excuse for commentary on a topic where every pundit, news anchor, and blogger has an opinion: The Fed. (See Fed authority Tim Duy if this is your personal concern). The approaching expiration of the debt limit extension is important.
Most important of all will be corporate earnings reports.
Briefing.com has a good U.S. economic calendar for the week (and many other good features which I monitor each day). Here are the main U.S. releases.
Next Week’s Theme
The normal calendar in a shortened week has an emphasis on housing. With Fed Speakers on the road and the Beige Book release, some pundits will choose to discuss the Fed. The looming government shutdown will attract plenty of attention. For investors, the Q417 earnings season, now in full swing, provides the most interesting fresh data. There is always room for interpretation, but this season also adds the complexity of the tax cut effects. More than ever, investors will be listening to earnings conferences with the hope of discovering new opportunities. Many will be asking:
How can we find meaning in the complex earnings story?
As usual, here is a typical range of opinion, from bearish to bullish.
- Earnings expectations are always too high in the early days but too low at the time of reports. Even a high “beat rate” will mean nothing.
- Earnings are manipulated and therefore meaningless. Look for companies that boosted results via “financial engineering” like stock buybacks, goodwill write-offs, and the like.
- Current earnings have little effect on the important long-term ratios, like CAPE. Only one quarter from ten years ago will drop out of the calculation.
- Forward earnings have a good correlation with stocks. This metric is looking very positive.
- Forward earnings estimates have defied the normal pattern – getting stronger rather than weaker.
- Forward earnings do not yet reflect possible tax cut effects.
The uncertainty makes this the most important earnings series in many years. As usual, I’ll confine my own interpretations to today’s Final Thought.
Quant Corner
We follow some regular featured sources and the best other quant news from the week.
Risk Analysis
I have a rule for my investment clients. Think first about your risk. Only then should you consider possible rewards. I monitor many quantitative reports and highlight the best methods in this weekly update.
The Indicator Snapshot
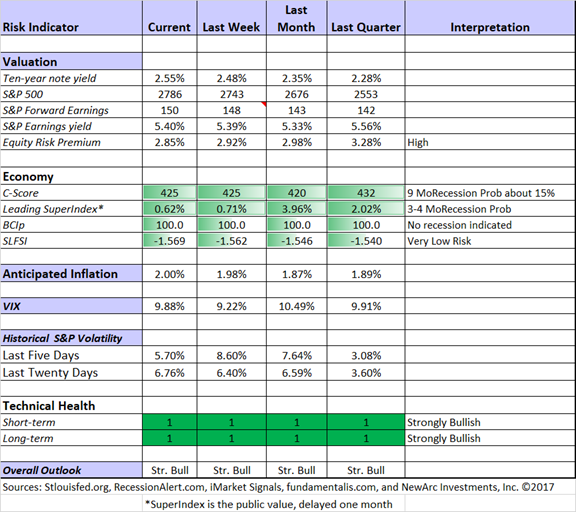
Recession odds remain low and many economic indicators are improving. The WSJ took note of the anticipated inflate rate of 2%.
The Featured Sources:
Bob Dieli: Business cycle analysis via the “C Score.
RecessionAlert: Strong quantitative indicators for both economic and market analysis.
Brian Gilmartin: All things earnings, for the overall market as well as many individual companies.
Georg Vrba: Business cycle indicator and market timing tools. None of Georg’s indicators signal recession.
Doug Short: Regular updating of an array of indicators. Great charts and analysis.
Insight for Traders
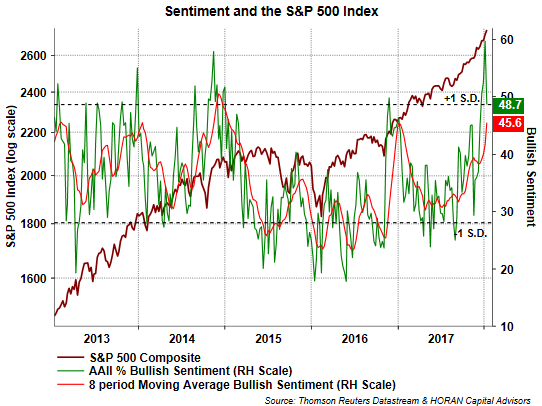
Our discussion of trading ideas has moved to the weekly Stock Exchange post. The coverage is bigger and better than ever. We combine links to trading articles, topical themes, and ideas from our trading models. This week’s post considers sentiment indicators, and a possible bearish turn. What does that mean for traders? Or for our cast of characters? Model performance updates are published, and of course, there are updated ratings lists for Felix and Oscar, this week featuring the DJIA components. Blue Harbinger has taken the lead role on this post, using information both from me and from the models. He is doing a great job, presenting a wealth of new ideas and information each week.
One of my favorite sources, HORAN Capital Advisors, also notes recent sentiment readings. David Templeton’s analysis suggests that this indicator is more actionable at market bottoms. Take a look at the full post.
Insight for Investors
Investors should have a long-term horizon. They can often exploit trading volatility!
Best of the Week
If I had to pick a single most important source for investors to read this week it would be Jake Varn’s (Bipartisan Policy Center) analysis of what to look and hope for in an infrastructure bill. This will be the breaking issue in a few weeks. Will 2018 be the year of infrastructure? Structured as a list of New Year’s resolutions – faster permitting, building capacity, better asset management, improving financing mechanisms – are all sensible. They seem like ideas anyone would support. The last resolution? Get Started. I hope this is not a hurdle too high for our leadership.
If you read this excellent post, you will know what to watch for as these ideas are discussed. You will also be well-prepared to find some stock ideas linked to the progress.
Stock Ideas
I suggest investors join me in reading selections from the first-rate Seeking Alpha Positioning for 2018 series. There are many good ideas. My own annual contribution will appear soon. I give it special effort and appreciate that I am often hitting clean-up on this series.
Korea? Barron’s “Preview” column mentions this idea. N. Korea is sending participants and cheerleaders to the Olympics. Stocks are beaten down and cheap compared to US shares. S. Korea shares are depressed for these and various other reasons. Is this a time to buy when the market is fearful?
Aflac? Eddy Elfenbein, a long-time holder of the “duck stock” explores both the fraud allegations and the company’s response. His analysis it great material both for those who hold the stock and those wondering whether it is a dip to buy.
Beaten-down stocks? Jon C. Ogg (24/7 Wall St) provides a shopping list (here and here) for your consideration.
Trading versus Investing?
I have always made a distinction, mostly based upon time frame, between trading and investing. I have split my weekly updates to reflect this, but some ideas still hit the “seam.”
Brett Steenbarger trades, advises traders, and writes great books to help them. His posts are often valuable for investors as well. This week his post provided another good example, discussing how strengths might become weaknesses.
The risk prudent trader can become risk averse.
The active trader can become overactive and distracted.
The competitive trader can become frustrated and unfocused.
The creative trader can flit from one idea to another, one system to another, never developing expertise.
The disciplined trader can become rigid and unable to adapt to a change in the market.
In all these cases, strengths can become vulnerabilities.
Substitute “investor” for “trader” and you will see the point.
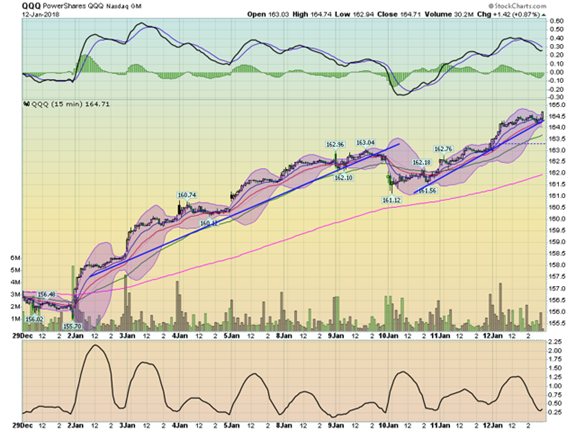
Hale Stewart, often cited here for deep fundamental analysis of individual stocks, has a new series with plenty of charts. Is this a technical emphasis? Here is how he explains it:
Before I move onto the charts, let me explain how I use technical analysis. I don’t like covering charts with trendlines and retracement levels. I use the Miles Davis or Jim Hall approach: do everything you can to distill the movements down to their essence. Most technical indicators simply confirm what the chart is telling you. Only the MACD really provides any meaningful data. In my experience, price movements, EMAs, and volume usually provide all the information you need.
I can relate to this. When choosing my stocks for fundamental programs I always (like everyone else) look at a chart. I use my own ideas (from 30 years of experience) and it seems to work well. It is not complicated. I read Hale’s charts with a similar attitude. Take a look at one where he identifies a bullish formation.
Outlook
Once again, you will be ROFL after reading Alan Steel’s “Revelation Game” post. Searching for investment gurus via Google, he finds a candidate. Here was the result:
According to the Skeptic Ink psychic network, of Nikkis 540 predictions in 2016 (there were some duplicates) she claimed 37 hits, meaning a raw success rate of approximately 6.85%.
And while she doesn’t compete well against a coin flip, her predictive nous is far cry more accurate than the aforementioned global strategist at Societe Generale, whose accuracy even when compared to the psychic world makes legendary perma-bear and investment pauper Joe Granville look like Warren Buffett.
Alan concludes with the key point: Many people follow this advice.
It is confirmation bias in action.
Barron’s roundtable edition is usually worth the price of the issue. (I am a long-time subscriber). This week is part one, with a strong consensus among participants about solid economic prospects. We’ll see the stock picks next week.
Personal Finance
Seeking Alpha Senior Editor Gil Weinreich continues his excellent series. It is helpful both for investors and advisors. This week, as usual, included several great entries, but my favorite is his discussion about the transition to retirement. As usual, he combines his always-helpful conclusions with links to useful posts.
Watch out for
The free lunch (actually often a dinner) for potential investors. This article revealed one way that it might not really be free. Quelle surprise! Mrs. OldProf gets a constant flow of these invitations, routing them directly to the recycling bin and suggesting that I take her out instead. I guess that means that the “free lunch” is actually an extra expense for me.
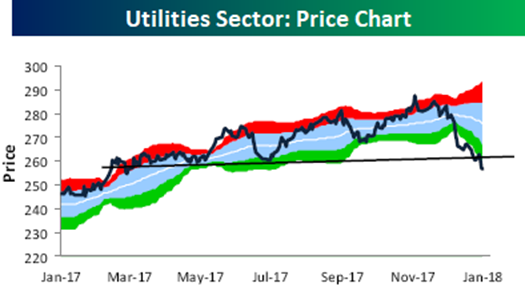
Utility stocks. The valuation levels from the crowded trade make them vulnerable to interest rate increases. Bespoke tracks the recent effects.
The cryptocurrency space. Must I keep writing about this? I guess so. More average people want to discuss this rather than stocks. Young baggers at the market endorse one type of crypto as a “can’t miss.” A Wall Street consultant firm reports on the impending crash.
I certainly do not know where Bitcoin will trade next week, but I do warn investors to be cautious. Make this part of your “fun money” or trading portfolio. The fundamental valuation eludes even the top experts.
Final Thoughts
Here is what I expect from earnings season.
- Earnings expectations were already rising this year, reversing the normal pattern. As always, we turn to the leading sources on earnings.
- Brian Gilmartin calls it the “earnings underbid.” He has a great explanation of the tax effects, with this summary:
Here is my two cents: it wont be that easy this quarter with the changes in the deferred tax asset and then any subsequent boost from share repurchases after December 22nd, or the date the Tax reform bill was signed.
I think these Q4 ’17 reports will quite “noisy” and analysts will have to adjust numbers to reflect operating results.
The other thing to note too is that I think the deferred tax assets / liabilities and any charges, will be “non-cash” and more GAAP related.
- John Butters notes that negative guidance is below the five-year average while positive guidance is strong. Here is his analysis by sector.
- Brian Gilmartin calls it the “earnings underbid.” He has a great explanation of the tax effects, with this summary:
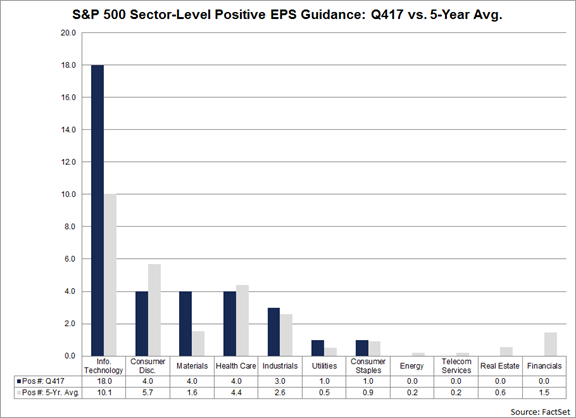
- These figures represent data before the tax cut effects. Analysts returning from vacation are still scrambling to identify specific effects on earnings and adjust estimates.
- While these specifics are elusive, we can count on Eddy Elfenbein to describe the overall impact in understandable terms.
The tax law lowers the corporate rate from 35% to 21%. Effectively, what that means is that the U.S. government is a silent partner in every American business.
Previously, they had an odd relationship with the partners as the government owned no part of the business yet was entitled to 35% of the final cash flow. All the other shareholders got the other 65%.
With this new law, the shareholders’ stake rises from 65% to 79%. They get an extra 14% at no cost. Imagine if you had a silent partner who said to you, “here, take my 14% and you don’t owe me anything.” Of course, that’s not literally what’s happened. But effectively, it’s pretty darn close.
This is a huge benefit for shareholders. It’s almost like overnight you got 20% more shares of all your stocks. This is especially good for many of our Buy List stocks because they’re very profitable. That’s why they pay a lot of taxes.
I tend to be skeptical of any models that try to determine a fair price for the entire market. This is an instance where the entire climate has changed. If I were a modeler, I’d have to update several of my variables (and not a few of my constants).
This is a dramatic illustration of the limits of backward looking valuation models. Do we care about what earnings were ten years ago? Or constants derived from 19th century data?
The successful investor realizes that people select individual stocks based upon expectations for future earnings and cash flow. The overall market should be evaluated in the same way.
I’m more worried about:
- The potential for a government shutdown. There are many routes to compromise, but they seem to be paths not chosen.
- Consumer sentiment. This is an economic driver that plunged after the 2011 debt ceiling negotiations, and that was despite the typical 11th hour result. Sentiment can be a cause of economic strength or weakness, not just a consequence.
I’m less worried about:
- North Korea. Despite the bluster, the North/South talks are a positive indicator. Perhaps the Olympics will be as well.
- The global economy. The strength in the US is being matched around the world.
