S&P 500 earnings update
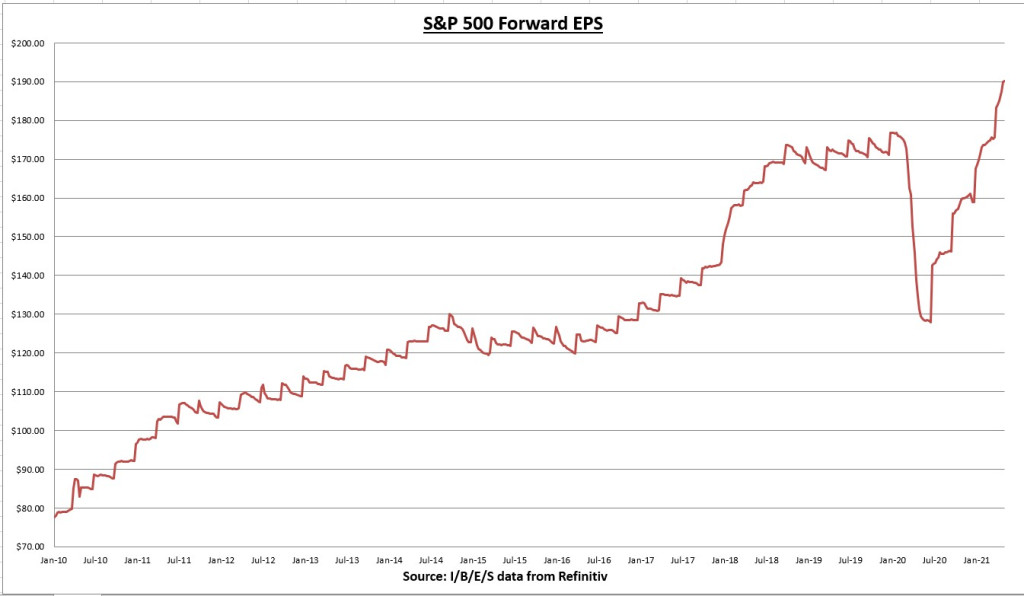
The earnings per share (EPS) for all S&P 500 companies combined increased to $190.12 this week, an increase of +0.08% for the week and +19.6% year to date.
91.4% of S&P 500 companies have now reported Q1 results, 87% have beaten estimates by a combined 22.9% above expectations. (I/B/E/S data from Refinitiv)
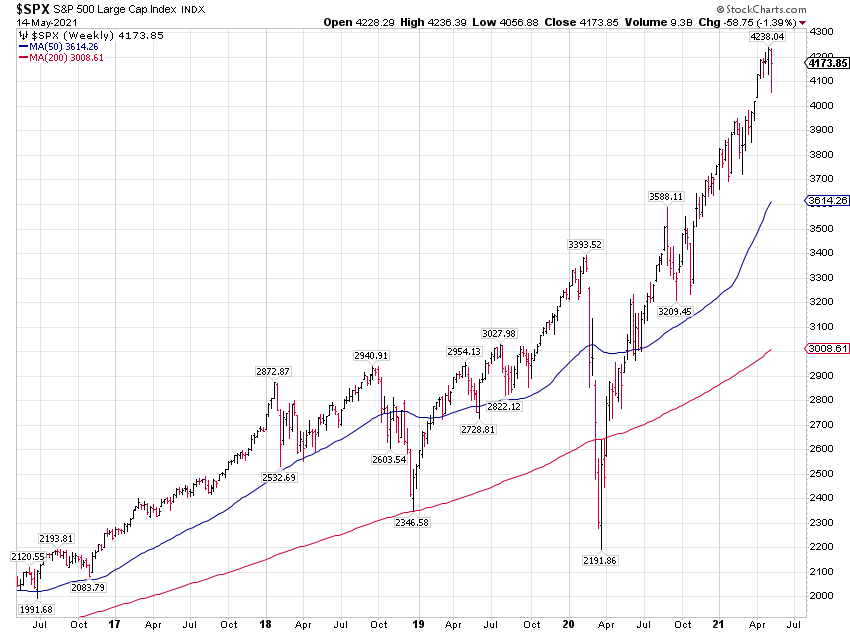
The S&P 500 index declined 1.39% for the week.
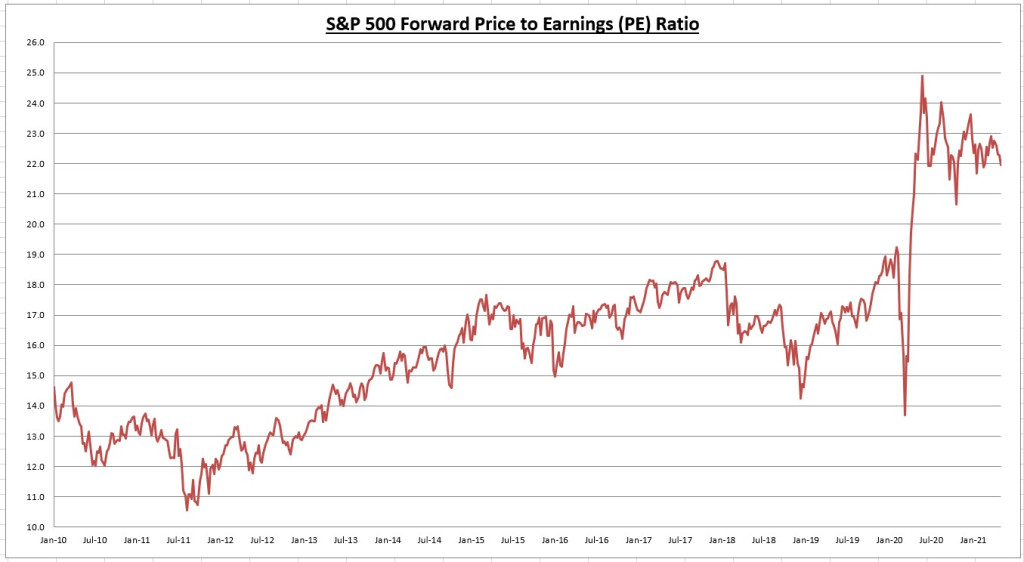
The Price to Earnings (PE) ratio is now 22x.
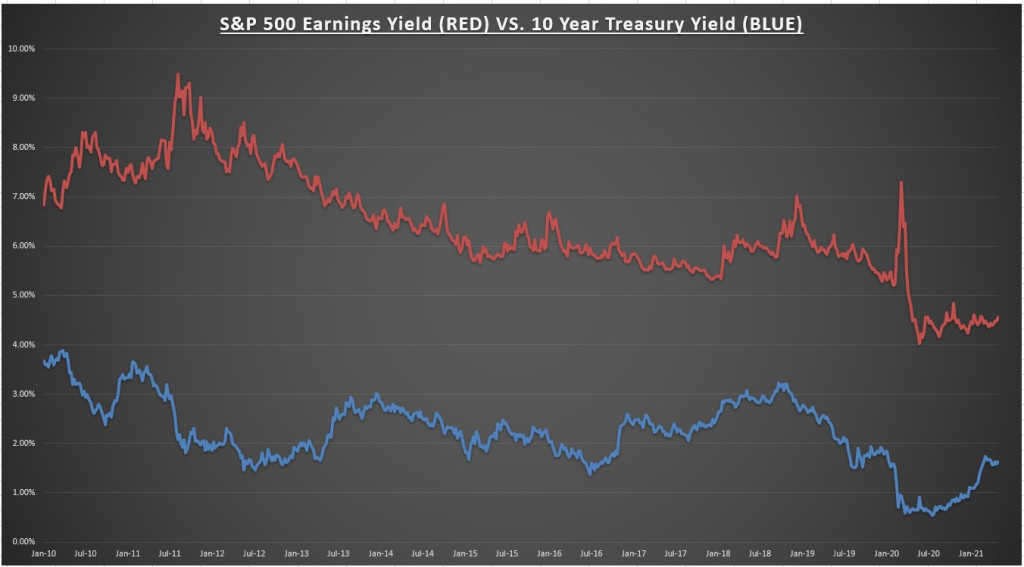
The S&P 500 earnings yield is now 4.56% compared to the 10-year treasury rate of 1.63%. Although valuation is not a timing tool, stocks remain reasonably priced compared to fixed income alternatives.
Economic data review
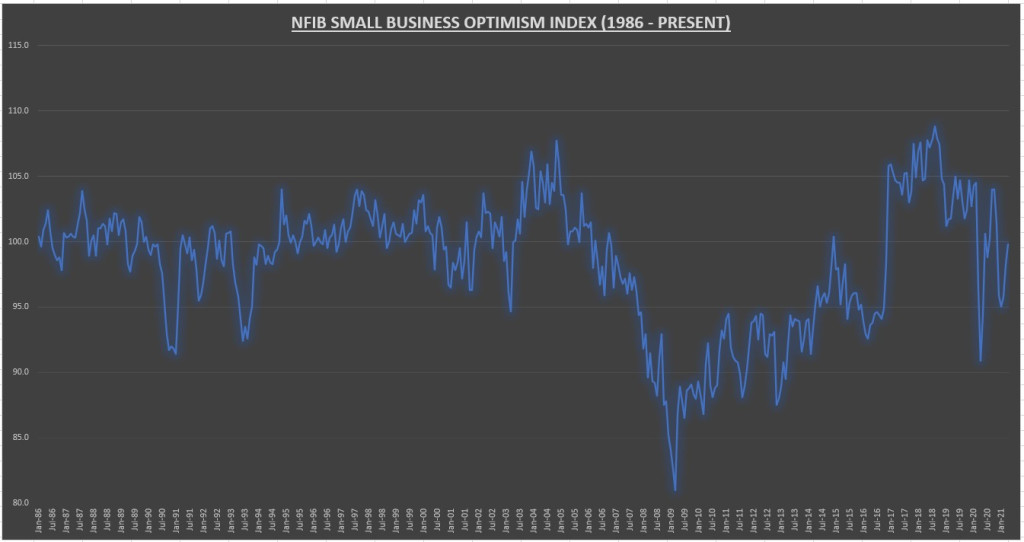
The NFIB Small Business optimism index for April came in at 99.8, a gain of 1.6% for the month and +9.8% over the last 12 months. The index began reporting monthly data on January 1986, and the historical average is now 98.4.
8 of 10 index components came in higher than the prior month but there are some disappointing trends underneath the surface.
- “Small business owners are seeing a growth in sales but are stunted by not having enough workers. Finding qualified employees remains the biggest challenge for small businesses and is slowing economic growth. Owners are raising compensation, offering bonuses and benefits to attract the right employees. 42% of owners reported job openings that could not be filled, a record high reading. Owners continue to have difficulty finding qualified workers to fill jobs as they compete with increased unemployment benefits and the pandemic keeping some workers out of the labor force.”
- “Owners are raising selling prices in frequencies not seen since the late 1970s and early 1980s, a period of our highest inflation rates in modern history. Inflation was running at double-digit rates and interest rates reflected the expected inflation. The 10 Year Treasury bond carried a 15% coupon. Today, it is at 1.5% and inflation is very low. This can change very quickly. We don’t have inflation until it shows up on Main Street, but it is beginning to do so.”
- The percent of owners expecting better business conditions over the next six months fell seven points to a net negative 15%, surprisingly glum.
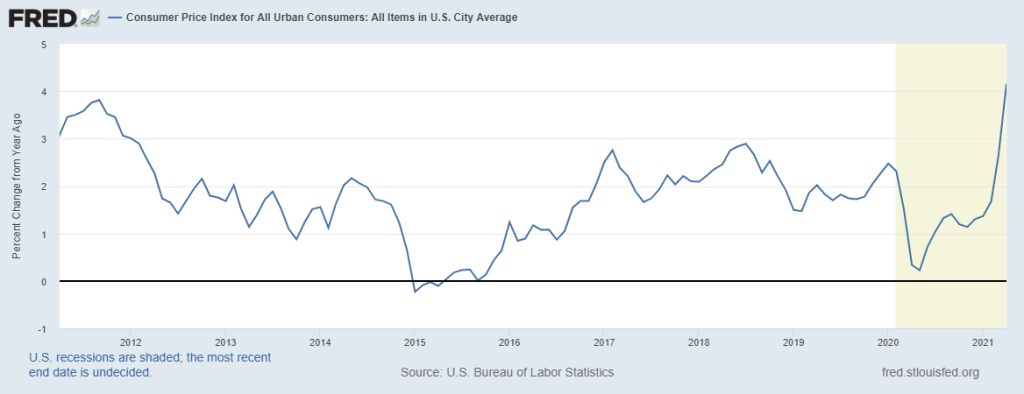
The Consumer Price Index (CPI) increased +0.8% in April, an increase of +4.2% annualized (up from +2.6% annualized last month). The biggest increases coming from energy (oil & gasoline) prices, +25.1% to +49.6% annualized. You’d have to go back to September 2008 to find a higher annualized CPI.
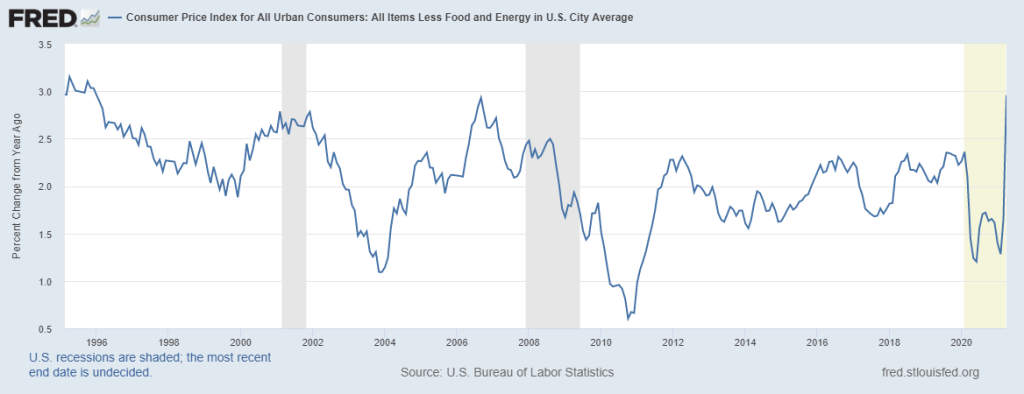
The Consumer Price Index minus food and energy costs (Core CPI) increased +0.9% in April, an annualized increase of 3.0% (up from +1.6% annualized last month). Much worse then expected and the highest annualized Core CPI reading since 1995. The biggest gains coming from the used cars & trucks and transportation service categories, up +5.6% and +21.0% annualized respectively.
In fairness, these annualized results are lapping the height of the COVID recession numbers. So I don’t want to make too much out of one month. I’ve been noting the small business and ISM reports rise in input costs for months. That, combined with the historic increase in the money supply, means it was only a matter of time before those price increases showed up on main street.
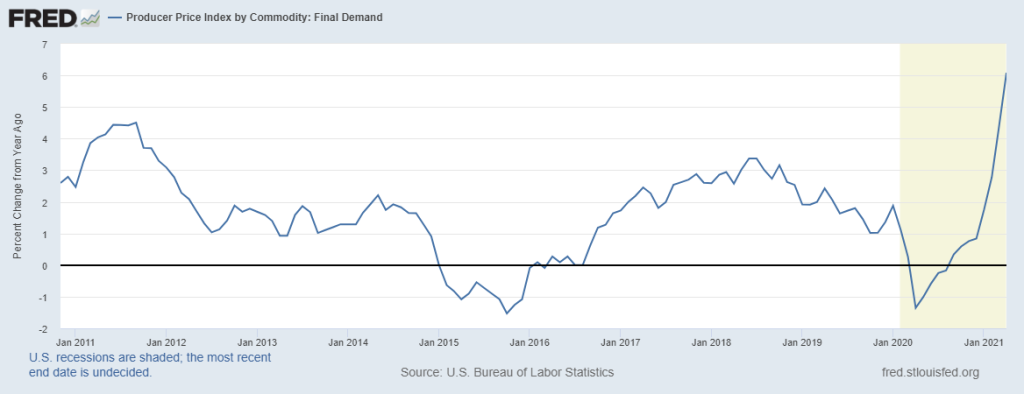
The Producer Price Index (PPI) increased +0.6% in April (worse then expected), and now stands at +6.1% annualized (up from +4.3% annualized last month), which is the highest annualized PPI since the data set began in November 2010.
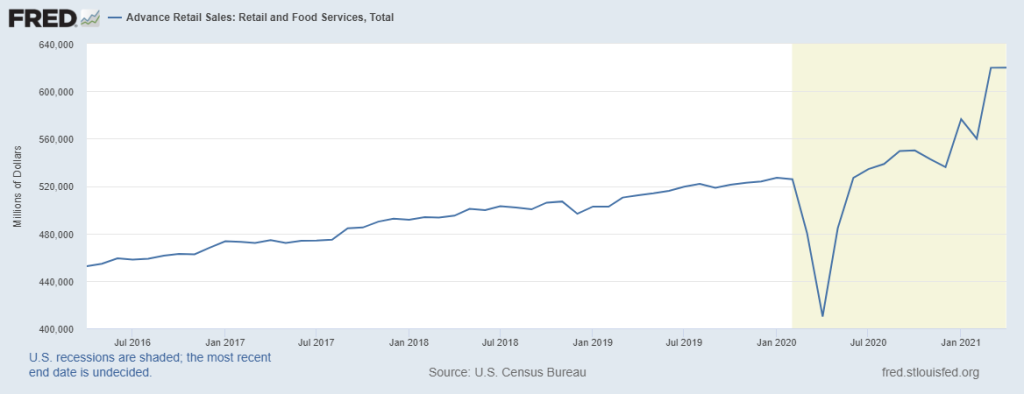
Total Retail Sales came in at $619.9 billion in April, relatively unchanged from the prior month. March numbers were revised upwards, from +9.7% to +10.7% annualized. Current results are now +17.7% above the pre-COVID highs.
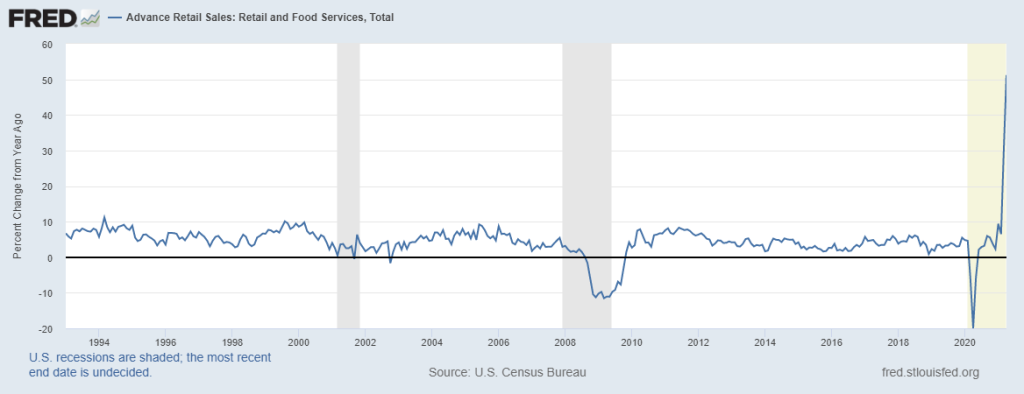
Total retail sales are up a whopping +51.2% above April 2020 results. Nothing even close to this growth rate since the data set began in the early 1990’s.
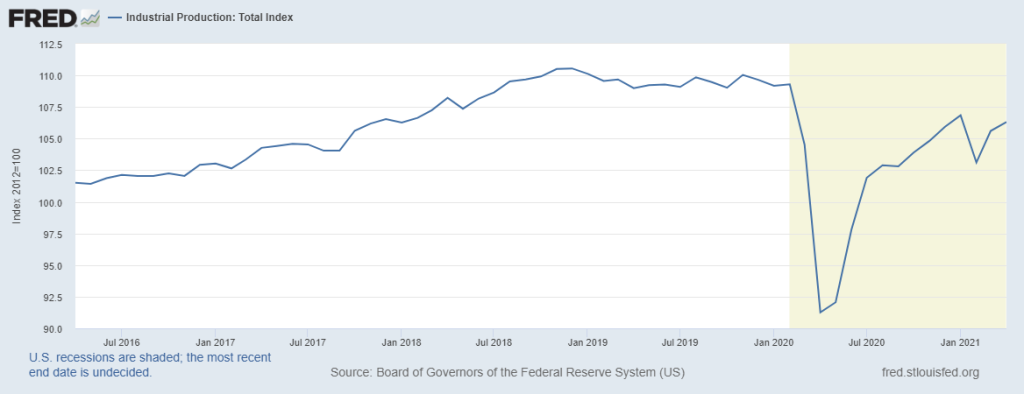
Industrial production increased +0.7% in April, (+16.5% annualized) as manufacturers recover from the severe weather impacts in the south central region, and deal with the delays caused by the continuing chip shortages. Industrial production has now recovered 83.5% of the COVID decline.
Chart of the week
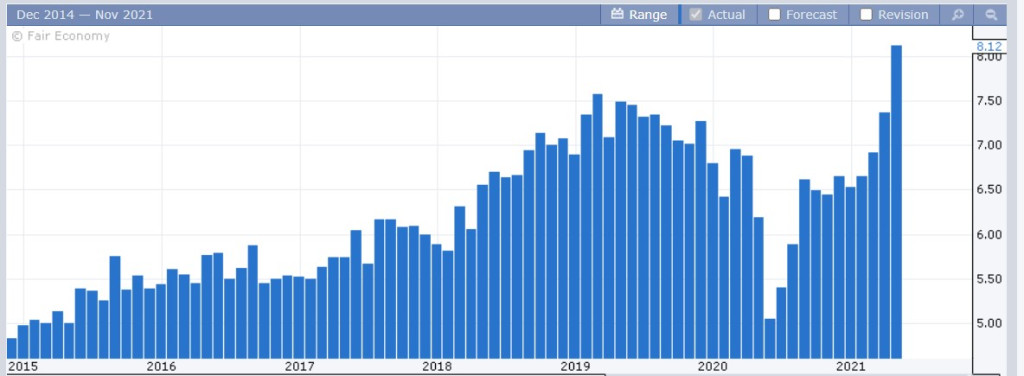
The Job Openings & Labor Turnover Survey (JOLTS) showed a record number of job openings (8.12 million) for the month, representing a gain of 7.8% over the prior month. The survey began reporting results on December 2000. These statistics confirm the supply of jobs isn’t the issue, its the demand for jobs (for a variety of reasons) that needs to catch up. I expect the demand to pick up as we progress through the year.
Summary
Regular readers know my biggest near term concern was not a deflationary double dip recession, but rather a “sugar high” economy that pushes cost of living expenses higher based on historic increases in the money supply. Here we are. In last weeks summary, I wondered out loud how the market would react to a CPI above 2%. The initial reaction wasn’t good, but the bond market actually took it in stride.
Much like last weeks disappointing jobs report, one month doesn’t make a trend. This months CPI was compared against the depths of the COVID shutdown, so we should expect it to be on the high side. The Fed believes this will be temporary. I wish I could tell how this will all play out. It would certainly make my life a lot easier. The truth is no one really knows.
The good news is earnings are so good that rates/inflation have a ways to go before they become a real threat to stock valuations. That doesn’t mean we can’t get a correction along the way. Those happen routinely even during the good times. Continue to expect above average economic growth, along with above average inflation, for the foreseeable future.
Next week we have 21 S&P 500 companies reporting earnings. I’ll be paying attention to Home Depot (NYSE:HD) on Tuesday. For economic data, we have the Conference Board’s Leading Economic Index (LEI) on Thursday.
