
Summary:
SPX, NDX and IXIC are now all at new all-time highs (ATH). The Russell 3000 and Wilshire 5000, which represent essentially all of US equities, are also at their prior highs. The trend remains higher. Moreover, strong starts to the year and multi-month gains have a very high propensity to lead to further gains in the months ahead and by year-end. There are precedents for the index to top now, but those are the exception.
Sentiment has become more bullish. This can certainly mark a top, but the historical record is inconsistent. It's a warning, not a red light.
In the most important respects, breadth is fine.
On balance, all of this leans bullish, but it would be a mistake to assume the indices will just sail higher in the remainder of the year. That can happen, but most often a drawdown much more than the barely 2% seen so far in 2019 will occur, even after a start like the current year.
* * *
US equities continue to grind higher. SPX, NDX and COMPQ ended the week at new ATHs. They have risen in each of the first 4 months of the year. The leader is NDX, which has risen 18 of the last 19 weeks since Christmas Eve (table from alphatrends.net).

Since January, we have said that SPX was likely to grind its way higher as the volatility index, VIX (lower panel), sunk under 16, just as it had in 2018. And in fact, that has been the case and remains so even as SPX exceeds its September high.

It might feel like the rise has been too much and too fast, but in fact, the average recovery to new highs after a steep plunge has been almost identical to that seen in the past half year (from Indexology).

Our perspective on US equities so far in 2019 has been the following:
Since the start of the year, the overwhelming evidence has indicated that the bull market remains intact, meaning new ATHs were still ahead this year. That has now been achieved.
With SPX, NDX and COMPQ at new ATHs, what lies ahead?
The persistence of the trend so far this year strongly suggests further gains in the months ahead.
The prolonged government shutdown coincided with a spate of ugly economic reports this winter, but data from the past month points to renewed growth. A recession starting in 2019 is unlikely, also supporting continued equity gains (a new post on this here).
This is one of the least volatile starts to a year in the past 90 years. The largest reaction so far this year has barely been more than 2%. A meatier reaction is odds on in the weeks and months ahead (a recent post on this is here).
The evidence:
SPX has now made a new ATH after having not done so for at least a half year. In the past 100 years, the index has been higher 3 months later, by an average of 2%, in 75% of the cases. In 100% of cases, the index has been higher at some point between 2 weeks and 6 months later and in 96% of cases it has been higher between 1 and 6 months later. With SPX not much higher than it was when it first made a new ATH on April 23, more gains a very likely ahead (from Troy Bombardia).

That's the good news (and there will be more examples of this below). But in the table above, note that within the next 3 months, only 12 of 28 instances (43%) just sailed higher. That's even more true over the next 6 months, as just 32% avoided any drawdown. In other words, the odds strongly favor either consolidation now or if there are interim gains, a period where those gains are given back.
Let's look at the past 40 years to illustrate that point, starting with the 2015-16 plunge. After regaining the prior high in June, SPX immediately dropped nearly 6%, then made a new ATH but essentially chopped sideways until December (4 months) before moving much higher.

After the 2011 plunge, SPX first moved 4% above its prior ATH but then gave all those gains (and more) back. Net, it went sideways over the next 5 months.

After the 2010 plunge, SPX immediately fell 4%, bounced back quickly and then marched to new highs (chart above).
The recovery from the 1998 plunge was like that in 2010: SPX immediately fell 4%, quickly bounced back and then marched much higher.

After the 1991 bear market, SPX first exceeded the prior high by 6% but then gave all those gains back. Net, it went sideways over the next 5 months, a pattern similar to 2011.

After the 1987 bear market, SPX first exceed the prior high by 7% but then gave all those gains (and more) back. Net, it went sideways over the next 9 months, a pattern similar to 2011 and 1991.

Finally, after regaining the losses from the 1982 bear market, SPX immediately lost 6%, then made a new ATH by 4%, then lost all those gains. Net, it went sideways over the next 3 months, a pattern similar to 2010 and 1998.

In summary, SPX is very likely to see more gains in the months ahead. It is also likely to see gains given back, a drawdown or a period consolidation that could last several months. It is, objectively, impossible to know with certainty in which order these will occur. The examples above are evenly split.
Other data gives a similar result.
SPX rose every month to start this year, something that has happened 14 other times in the past 65 years. At the end of the year, all but one (93%) closed higher by a median of 10%. But within the next 4 months, just 29% sailed higher without any end of month drawdown. In most cases, a period chop, consolidation or retracement ensued, which ultimately resolved higher (the next two tables from Steve Deppe).

Likewise, SPX rose more than 15% in the past 4 months, something that has happened 21 other times in the past 50 years. 8 months later (by year end, in the current case), SPX has closed higher 81% of the time by a median of 9%. SPX has closed higher between 1 and 8 months later in all but one instance (95%). Only 1980 was a complete failure. Interestingly, in half of these instances, SPX sailed higher without any drawdown by the end of the month.

SPX is off to its 3rd best start to the year in the past 70 years. The index has then gone on to close the year higher 85% of the time. April was high for the rest of the year in both 1971 and 2011, so there is the precedent for this to be as good as it gets. The other failure was 1987, which had the worst performance of any year by year end, losing 14%, but there's an important caveat: between May and August 1987, SPX gained another 17% (from Jeff Hirsch).
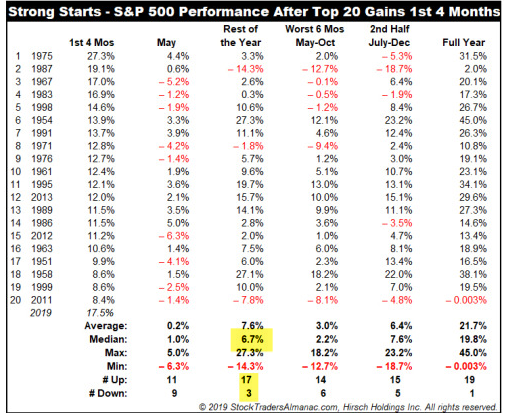
For what it's worth, 1971 is not very analogous to today. The year was closely sandwiched between two recessions and bear markets. In comparison, the US is now in a 10-year expansion (from Stooq).

Finally, in the past 70 years, SPX has gained an average of 14% in the year after mid-term elections. While SPX has rallied, it is up only 7% since the election last year. Of course, it may outperform or underperform this average but, on this basis at least, it would be 'normal' for the index to rise further into November (from Ryan Detrick).

Again, the evidence presented above suggests SPX is very likely to see more gains by year end, but it is also likely to see gains given back or a period of consolidation.
Sentiment data is mixed, but there is certainly less of tailwind now than in the past 4 months.
The most bearish data is from Investors Intelligence (newsletter writers). This week, bulls minus bears equaled 38%. When this has exceeded 40%, SPX soon peaked in 2007, 2011 and last September (red lines). But extremes in bullish sentiment are not the same bearish sentiment extremes (which often mark lows). As the chart below shows, bullish sentiment as often been followed by more gains (green lines) or just a period of consolidation and then more gains (yellow lines). It's a warning, but not conclusive on its own (from Vix Squared).

Likewise, sentiment amongst analysts finally climbed back to 66% this week. That marked the high in late-2015. But bulls exceeded 70% before peaks last September and in mid-2015, and bulls exceeded 75% before peaks in 2010, 2011, 2012 and in January 2018. Could SPX peak here? Yes, but it could just as well grind higher until sentiment is more clearly at an extreme (from Helene Meisler). 
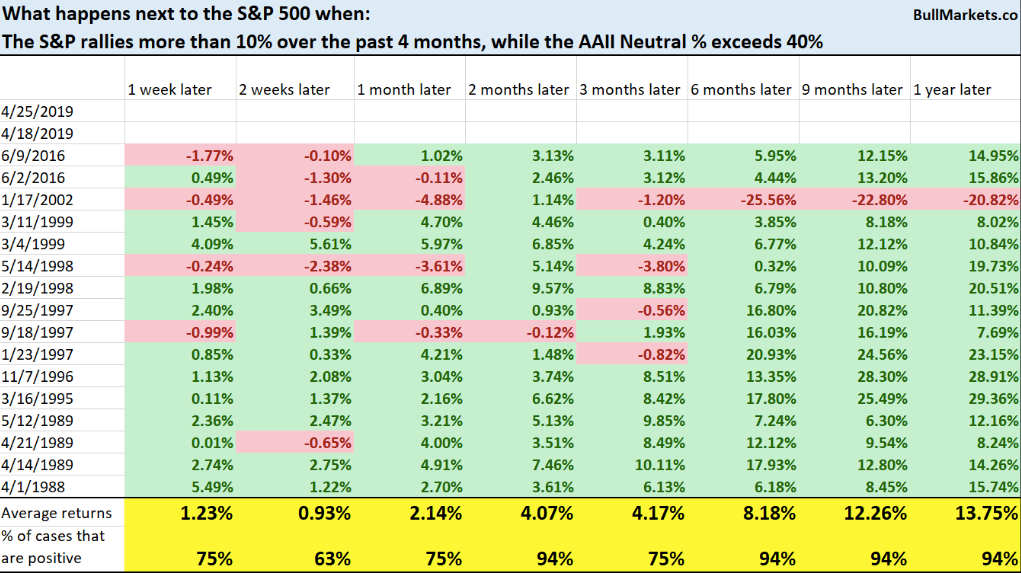
AAII (retail investors) have been more 'neutral' than bullish. In the past 32 years, when SPX has rallied more than 10% but investors remain mostly neutral, SPX has closed higher 2, 6 and 9 months later in all instances but one (94%; (from Troy Bombardia).
Fund flows, which reflects how investors are actually deploying their money, runs contrary to the survey data presented above. Investors have been putting their money into the safety of fixed income throughout the current rally. Equity funds flows have been weak, unlike the lead into peaks in 2000, 2007 and even 2015 (from JPM).

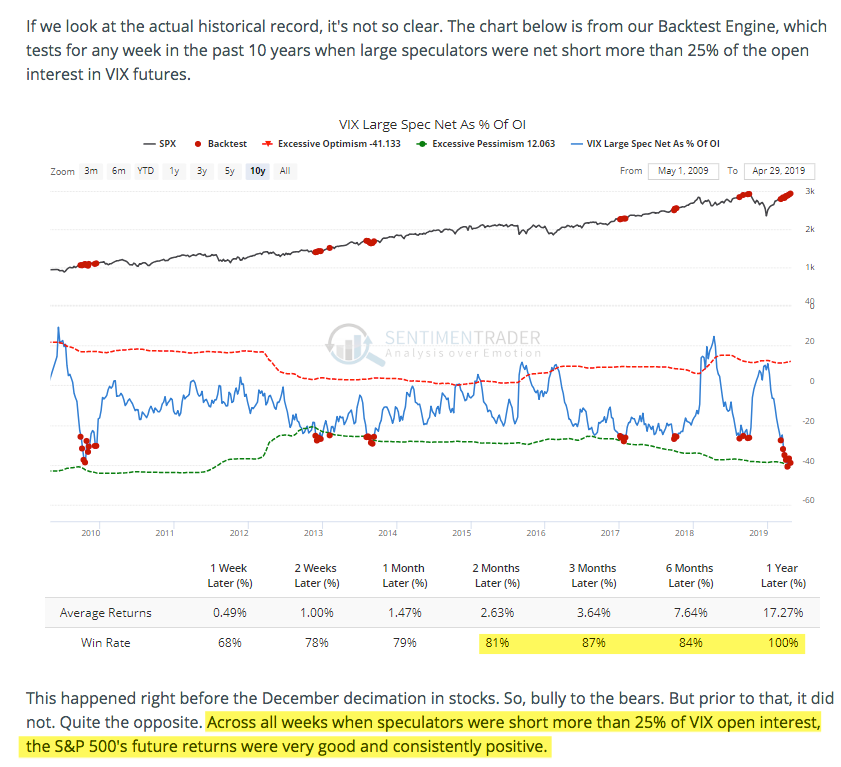
It's true that investors have been shorting the volatility index, Vix, leading to worries that the opposite is likely to happen: an explosion in volatility, usually coinciding with a decline in SPX. But that has historically not been the case. SPX has normally continued to rise (the next two charts are from Sentimentrader; to become a subscriber and support the Fat Pitch, click here).
Hedge funds have low exposure to equities. This would seem to be an indication that sophisticated investors are betting against the rally - a warning. But that has not been the case, historically. In fact, the best performance for SPX has occurred in precisely these circumstances, with annualized gains of more than 10%.

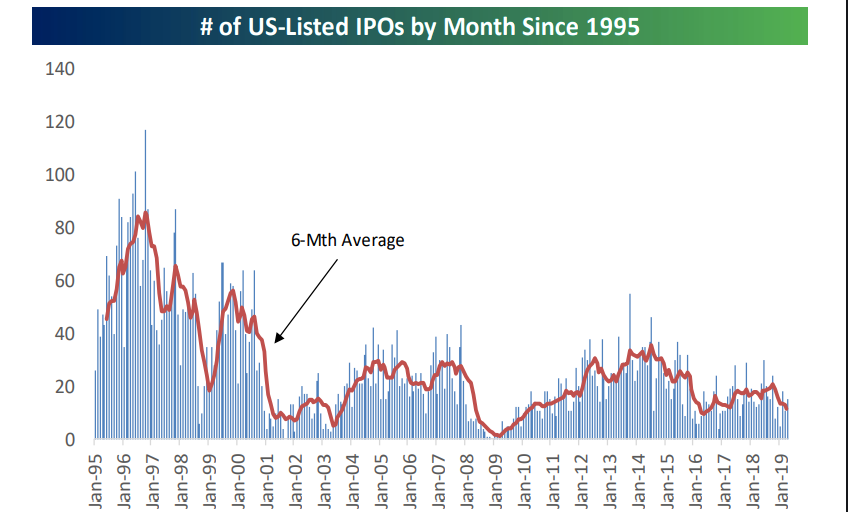
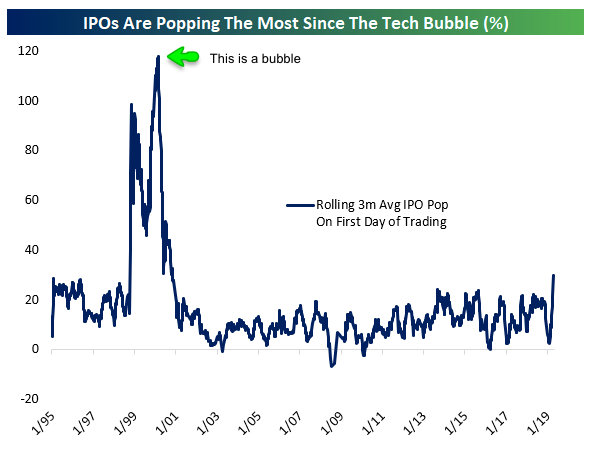
The IPO market is also heating up. This past week, Beyond Meat rose over 160% on its first day of trading, leading to worries that this is just like the lead into the dot com bubble. But there haven't been anywhere near that many IPOs this year (first chart) and while gains on the first day are on the rise, they are a far cry from levels seen 20 years ago (both charts from Bespoke).
Breadth does not appear to be an impediment to further equity gains.
First, the rally has been broadly-based. The equal-weight versions of SPX and NDX made new ATHs ahead of the traditional market-weight indices. That means that the larger market cap stocks were not solely responsible for the advance. In fact, the FAANG stocks have been lagging.
Moreover, this week, both the Wilshire 5000 and the Russell 3000, which represent 98% of US equities, returned to their ATHs.

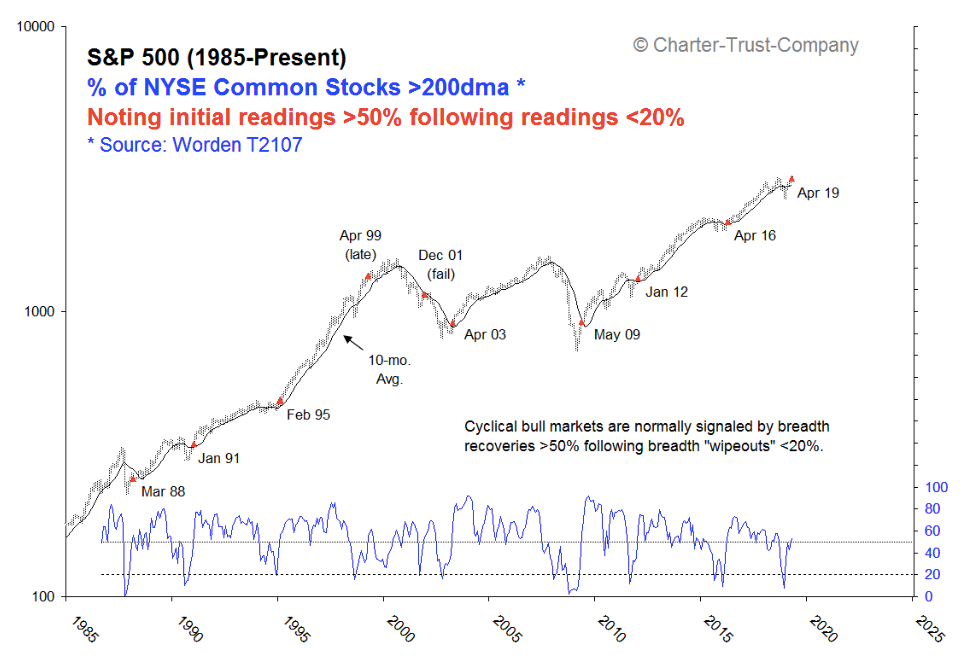
Second, after a breadth washout in December, the percent of the NYSE back above their 200-DMA is now back above 50%. This is analogous to the recoveries in 1991, 1995, 2012 and 2016, among others, after which SPX continued to rise (from Mark Ungewitter).
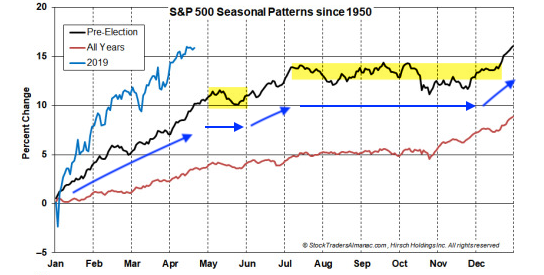
Seasonality, which can be inconsistent, favors some interim weakness in May and/or June. In pre-election years (like now), the second half of May has been weak, on average. The late summer and autumn is also a period with few net gains (from Jeff Hirsch).
There is probably more short-term upside, however. That the COMPQ gained 1% to a new ATH on Friday, following the good employment report, has historically led to further gains over the next week 89% of the time, with risk/reward 3:1 positive (from Quantifiable Edges).

NDX was the first index to make a new ATH. It leads, but momentum has started to wane over the past 2 weeks (top panel). It might just be consolidating gains while holding above prior resistance. At this point, there is no foul until this week's low is breached.

There are no important macro reports this week. The following week, however, has retail sales, industrial production and new home sales.
