Get 40% Off
🚨 Volatile Markets? Find Hidden Gems for Serious OutperformanceFind Stocks Now

Weekly Inflation Outlook: Peak CPI? Wait, Don’t Answer Yet

Published 06/13/2022, 07:33 AM
Updated 02/22/2024, 09:00 AM

This article was written exclusively for Investing.com

And here, we all thought that CPI was at least at a local peak. The interbank market, prior to Friday’s report, was already trading forward CPI prints at levels that implied “Peak CPI” was yet to come, but few thought it would happen so soon. And yet, Friday’s report put the y/y headline CPI at 8.6%, besting March’s much celebrated figure.

Obviously, a lot of the impetus for the new peak came from the persistent rise in gasoline prices, which continued their relentless increase after a brief pause in recognition of Biden’s flush of oil from the Strategic Petroleum Reserve. Of note, the Administration on Friday announced that it has inquired from industry about how it can help improve refinery output. (The gasoline market immediately dropped, which illustrates that there are a lot of traders who don’t realize that building a new refinery is a decade-long process that hasn’t been done in the US since 1972. The crude oil market also immediately dropped, which illustrates that there are a lot of traders who don’t realize that increasing refinery throughput would increase crude oil demand on the front end. Or, perhaps, this trading was all done by stupid bots interpreting the headline as bearish, which is my guess.)
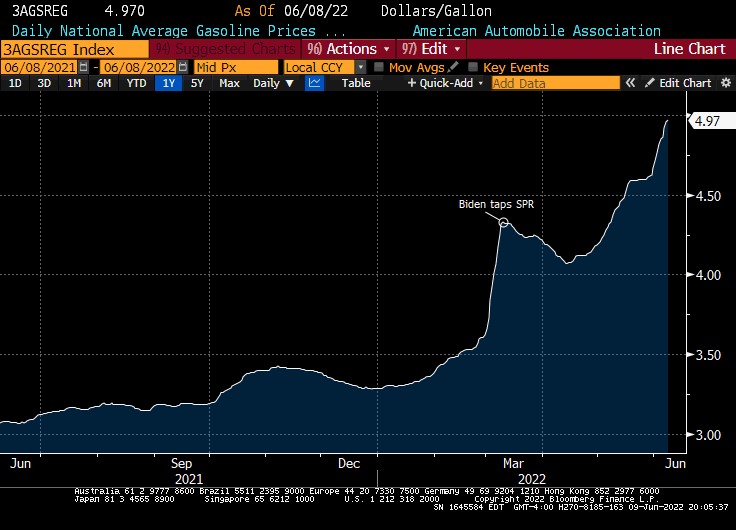
Daily Average US Gasoline Prices

But the Core CPI was also higher than expected. It came in below the earlier peak but nonetheless demonstrates that this is not entirely about gasoline.

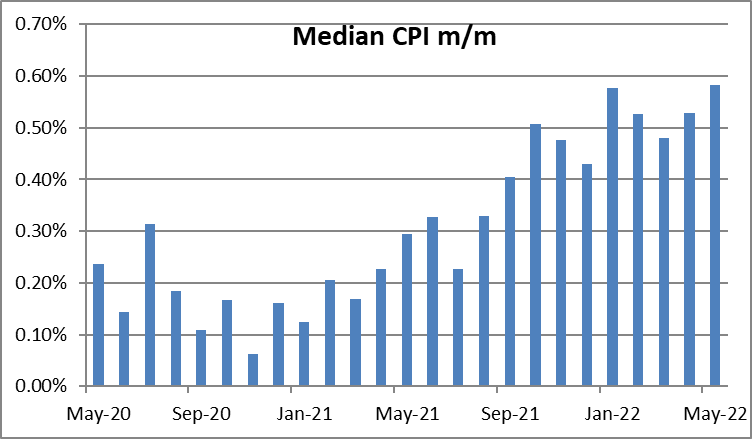
After difficult comps from May and June 2021, core CPI faces easy comps in July, August, and September. Another peak is thus probably likely in core CPI as well. Also, slower/better measures like Median CPI continue to accelerate. And price pressures are not yet ebbing.
3rd party Ad. Not an offer or recommendation by Investing.com. See disclosure here or remove ads .

Median CPI M/M 2020-2022

The data itself showed a continuation of recent trends: increasing shelter inflation and a general broadening of inflation so that it is now infecting most of the consumption basket. In other words, we are all getting poorer.

The good news, such as it is, is that wages are accelerating and are at least reflecting some of the increased cost of living. The spike in food and energy is not being passed through, but at least the rise in median inflation is getting into wages. Well, that’s good in the short term, if you’re one of those getting a wage increase, but it also reinforces the upcycle.

In the following chart, the dotted line is the Atlanta Fed Wage Growth Tracker and the white line is median CPI.
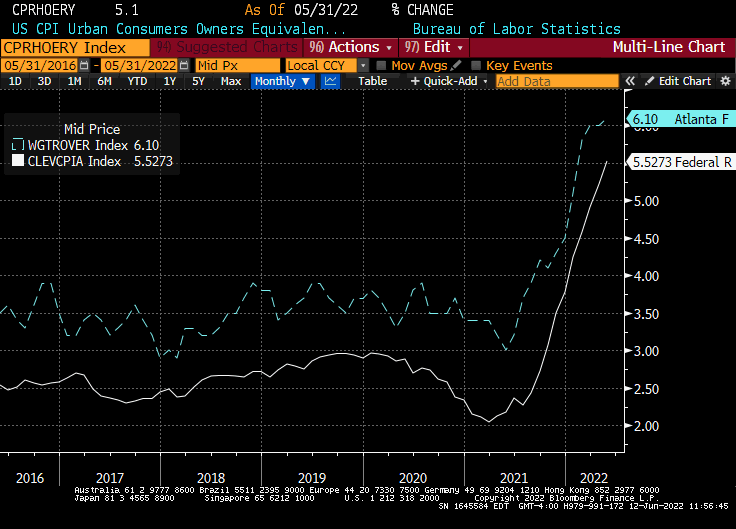
US CPI Urban Consumers vs Wages vs Median CPI 2016-2022

Now, naturally, once the recession arrives and there is a bigger pool of available labor, it will become harder for workers to keep up. And a recession is, of course, coming.

Yes, unemployment is low and the economy is still growing. But it would be a truly amazing thing if a doubling of oil prices and a spike in interest rates was not followed by a recession—either of those things has been known to cause an economy to contract and I am not aware of any time that both happened and we did not experience recession.

However, remember that recession is not a cure for inflation. Just look to the 1970s to see a counterexample. The central bank must contract the money supply to do so—and, for the first time since the advent of modern central banking, the Fed is attempting to slow inflation by changing interest rates and not by restricting reserves.

3rd party Ad. Not an offer or recommendation by Investing.com. See disclosure here or remove ads .

This doesn’t seem like a great time for such an experiment, but when you have no idea what you’re doing, every day is an experiment.

Taking a Step Back…

Inflation conspiracy nuts are fond of pointing out that the government made a significant change to the calculation of CPI in the early 1980s and that therefore inflation is really much higher than the government claims. It’s nonsense, which I’ve taken down elsewhere, but it is true that the Bureau of Labor Statistics (BLS) has changed the CPI over the years and did make a major change in the early 1980s.

These changes have generally been improvements, and the 1983 change to the treatment of Owner-Occupied Housing corrected some major problems with CPI. Notably, prior to the change mortgage interest was taken to be a major component of shelter costs. But housing is both an investment good and a consumption good, and including the financing cost of owning the asset was inappropriate…not only that, doing so meant that when the Fed was tightening CPI would mechanically go up (because it included interest rates!) and when the Fed was easing CPI would mechanically fall.

We have known this, obviously, since the 1970s and the 1983 correction to the method was the result of a public, decade-long research and analysis process (not a change made in a smoky back room by the Illuminati, as some would have you believe). But it does mean that the inflation of today is not directly comparable to the inflation of the late ‘70s/early ‘80s.

3rd party Ad. Not an offer or recommendation by Investing.com. See disclosure here or remove ads .

In a brilliant paper published last week (one characteristic of a brilliant paper is that it makes the reader think, “why didn’t I think about doing that?”), Marijn Bolhuis, Judd Cramer, and Larry Summers (yes, that Larry Summers) took today’s methodology and applied it backwards to see where inflation would have been in the last inflation crisis, had current methodologies been used then.

It is an easy paper to read and worth the time. And here is the upshot:

  • Inflation in the 1980s was not as high as we thought at the time.
  • Unfortunately, that means we are much closer to those highs than we would think, comparing CPI to CPI.
  • Moreover, inflation today is likely to be stickier, because more of the consumption basket is in sticky items (like housing) than in flexible items like food and apparel, etc.

The upshot of this is that interest rates are going to have to go higher than the market currently expects that they will; higher than the Federal Reserve has previously said they would need to (with the “dot plot” peaking around 2.75%). And, they will need to stay there longer. This is bad news for stocks and bonds, neither of which is incorporating an outcome remotely that bad. And, of course, it’s bad news for all of us.

This entire inflation episode has seemed like one of those old commercials where, just when you think you’ve heard the whole pitch, Ron Popeil says “don’t answer yet! Just look what else you get!” Well, it seems that we are going to keep getting it. And we probably don’t have to wait 6-8 weeks for delivery.

3rd party Ad. Not an offer or recommendation by Investing.com. See disclosure here or remove ads .

***

Michael Ashton, sometimes known as The Inflation Guy, is the Managing Principal of Enduring Investments, LLC. He's a pioneer in inflation markets with a specialty in defending wealth against the assaults of economic inflation, which he discusses on his Cents and Sensibility podcast.

Latest comments

Great thoughts, well written.
Substitution in the CPI was to a small degree necessary for accurately reflecting consumption. However it has become a larger component of the calculation. For example, if steak ribeye steak is expensive, the consumer may likely switch to a cheaper cut. The real problem, over time, ground beef gets substituted for steak and chicken breast gets substituted for ground beef, then chicken thighs for chicken breast....and so on. Seniors get hurt the most as COLA adjustments to S.S. are based on a CPI loaded with cheaper substitutions.
Hi Michael, thank you for all the great articles and info provided. My questions is where or what software is used to watch the graphs that you uploaded as screenshots?
One of them is Excel, but the two I think you're referring two are from the Bloomberg system.
Great article!!
who are the culprits or companies which first coined the term peak inflation ?
These articles are usually very informative but I have to disagree with your view of old CPI measures Vs the new ones. Not even taking into account things like hedonics and substitution (which are only used to reflect lower prices, never higher), today's CPI is completely not an accurate measure of real general rising prices. Best example is the owner's equivalent rent which is a gauge that measures what some homeowners may possibly rent their rooms out for (that contributes to a third of CPI reading) but is also a rent nobody pays. Market measures of rent suggest something closer to a 15%-20% y/y rise Vs a meager 5% from the fake input of OER. To say it's a conspiracy that CPI wouldn't be higher than any reading ever if we used the old formula is false. It clearly would be and there's too many reasons to clearly see why it would be a more accurate measure, making the so called "conspiracy" people more aware than most market analysts.
(continued) hedonic adjustment has very little impact on inflation. The BLS also accounts for "shrinkflation," by making quality adjustments when packaging amounts decline. You can even prove mathematically that the BLS can't be WILDLY off (see my blog and search for "Eighth-Grade Math vs Shadowstats"). The CPI isn't "right" any more than Unemployment or GDP is "right." But it's a pretty darn good guess. Third-party estimates (such as by the Billion Prices Project) have generally found it's pretty close. IMO, the bigger problem is with things like new products, especially in medical care where we don't measure "survival rates" as a measure of quality. Those things would probably lower CPI some although not a ton. So CPI isn't perfect. But as government numbers go...it's pretty good. I respect your opinion.
I don't think I phrased it clearly, but when talking about hedonics and substitution I meant that I believe that the way it's used seems understate CPI readings (not that it it isn't taken into account). Example being the cost of air travel not taking into account the terrible decline in service and all the little hidden fees they add for anything considered basic by most travellers. I'm also curious to know your opinion of John Williams "shadowstats" website and his take on the readings. As a whole we'd probably have to agree to disagree, but I'm subscribed and still look forward to your articles good sir.
 Well, I can't really disagree that quality adjustment misses some of those things. Some on both sides, but on the whole it certainly seems like SERVICE has gotten progressively worse. I don't know how big the effect is, but I agree with you on the sign. As for what I think about shadowstats...I have written a bunch of proofs that his methods are just plain wrong. I think he's a huckster who makes money off of conspiracy theorists. My most-recent takedown is here: https://mikeashton.wordpress.com/2021/05/25/eighth-grade-math-vs-shadowstats/ I hate to give him air time. There are reasons the CPI seems high to everyone. We have cognitive biases which all tend to increase our perception of CPI. I wrote a paper a long time ago about this: https://link.springer.com/article/10.1057/be.2011.35 Long story short...we're just not cut out to correctly perceive inflation.
Risk Disclosure: Trading in financial instruments and/or cryptocurrencies involves high risks including the risk of losing some, or all, of your investment amount, and may not be suitable for all investors. Prices of cryptocurrencies are extremely volatile and may be affected by external factors such as financial, regulatory or political events. Trading on margin increases the financial risks.
Before deciding to trade in financial instrument or cryptocurrencies you should be fully informed of the risks and costs associated with trading the financial markets, carefully consider your investment objectives, level of experience, and risk appetite, and seek professional advice where needed.
Fusion Media would like to remind you that the data contained in this website is not necessarily real-time nor accurate. The data and prices on the website are not necessarily provided by any market or exchange, but may be provided by market makers, and so prices may not be accurate and may differ from the actual price at any given market, meaning prices are indicative and not appropriate for trading purposes. Fusion Media and any provider of the data contained in this website will not accept liability for any loss or damage as a result of your trading, or your reliance on the information contained within this website.
It is prohibited to use, store, reproduce, display, modify, transmit or distribute the data contained in this website without the explicit prior written permission of Fusion Media and/or the data provider. All intellectual property rights are reserved by the providers and/or the exchange providing the data contained in this website.
Fusion Media may be compensated by the advertisers that appear on the website, based on your interaction with the advertisements or advertisers.
© 2007-2024 - Fusion Media Limited. All Rights Reserved.