US Dollar Fundamental Analysis:
Politics took the main stage again last week on renewed accusations of President Trump colluding with Russian officials to win last year’s election in the US. The news precipitated a selloff across the board of the already dwindling US dollar as investors now started to seriously doubt that Trump will deliver the promised tax reform.
Almost all of the key economic reports were weaker than forecasted last week which just helped to accelerate the slide in the currency. The dollar index, a broad weighted index of the US dollar against a basket of currencies, is now down back to pre-election levels last seen in November.
Several Fed Presidents will speak throughout the week while the FOMC minutes from their last meeting will be released on Wednesday. A strong hawkish signal that they are still on course to raise rates in June will be needed to help the US dollar fight off further declines.
EUR/USD:
Fundamentals
The euro rallied sharply last week on the back of a weak dollar and continued resilience of its economy. Most of Eurozone economic data last week was either better than or in line with expectations hence investors continued to cut their euro short positions bringing EUR/USD higher with it. The commitment of traders report showed futures traders have turned net positive on the euro for the first time in 3 years, in expectation of the ECB announcing a more hawkish stance next month.
Manufacturing and services activity from several EU countries measured with the PMI indexes will be in focus this week as well as President Draghi speech on Wednesday.
Technicals
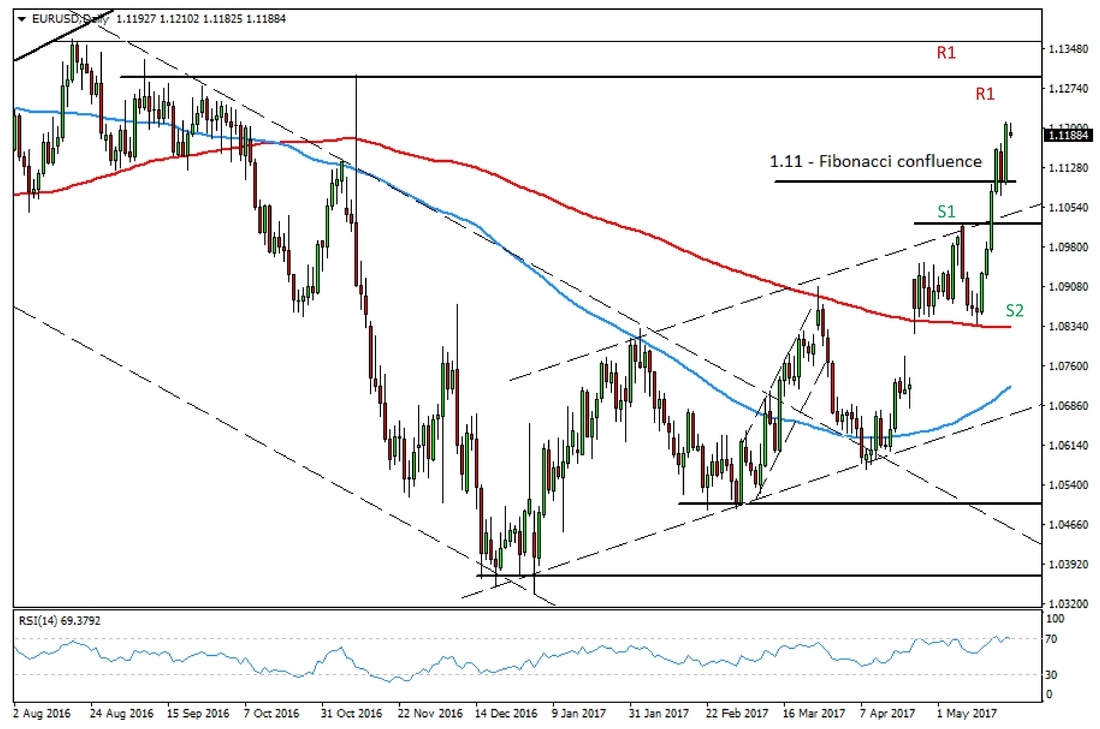
The pair easily went through the 1.11 Fibonacci confluence resistance, then retraced back to it to re-test it and pushed higher again on Friday to end the week at the highs. This is significant because it suggests that there is at least a little bit more upside room, however, momentum indicators now are flashing overbought levels.
Considering that the 1.1300 – 1.1350 area is very strong resistance it’s likely that EUR/USD will peak either before reaching this area or at it, at least until the ECB meeting next month.
If on the other hand, the pair reverses, the high at 1.1030 will act as support and the 1.1000 area should stop declines if the uptrend is to stay.
EUR/USD Daily chart – Uptrend reaching stretched levels
GBP/USD:
Fundamentals
Sterling had an interesting past week as all the key data were better than expected. However, the currency first fell after the better than forecasted CPI report as the Bank of England said it’s prepared to look past inflation and keep interest rates low. However, the jobs data and retail sales later in the week also surprised markedly to the upside and traders had to respect the persistently positive UK economic data and take the pound higher.
The second estimate GDP is the main release for this week, while traders should also keep an eye on the inflation report hearings at Parlament of BOE Governor Carney on Tuesday.
Technicals
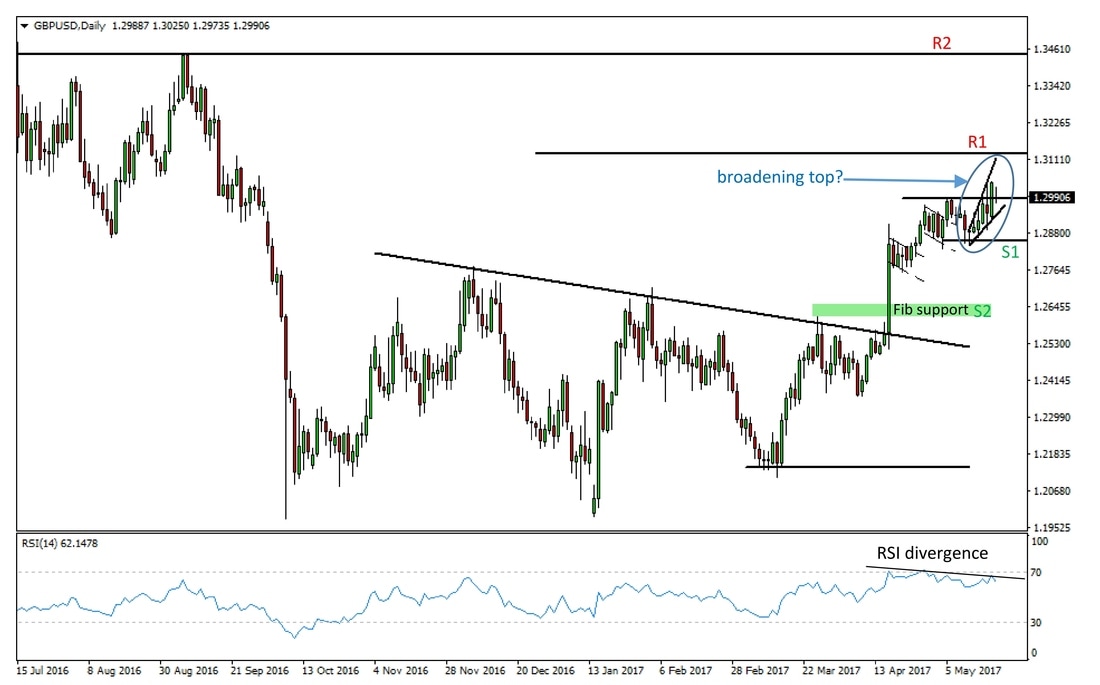
Although GBP/USD broke out of the trading range to the upside last week, an extended move higher seems doubtful at least. There are several indications of a top being formed, particularly the broadening formation and the RSI divergence shown on the chart are signaling that a peak is near.
The 1.3120 resistance area (R1) is also near strengthening the case for a top in the stretched uptrend. 1.2850 (S1) and 1.2650 (S2) remain support areas to the downside.
GBP/USD Daily chart - Topping signals start to flash
USD/JPY:
Fundamentals
USD/JPY naturally tumbled on last week’s broad risk-off move and was the strongest currency of all together with the euro. Japanese economic data was also generally positive helping to lift the yen. Several data points on inflation will be released this week and strong numbers there could boost the yen further.
However, the yen’s main driver is still likely to be the risk on or off sentiment in the market. Watching the political developments in relation to the Trump’s scandal on possible involvement with the Russians will be key here.
Technicals
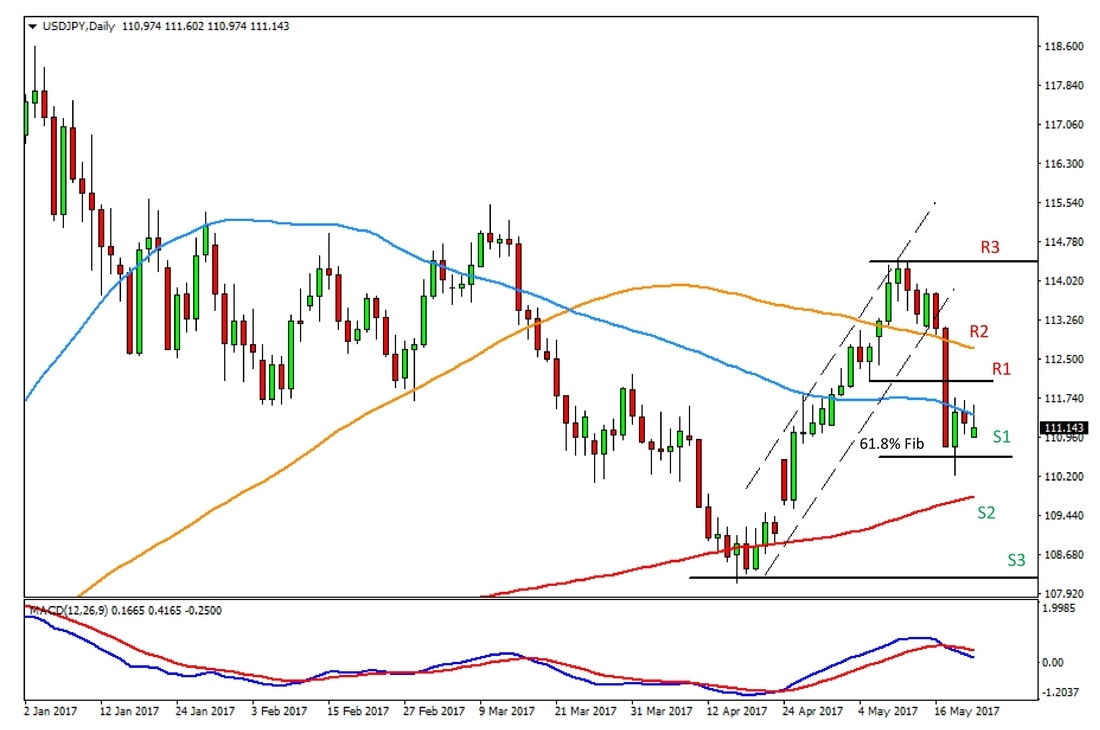
While the bullish Gartley pattern that we showed last week failed, USD/JPY did not break through all the support levels to the downside. The pair was held off by the 61.8% Fibonacci retracement and is still consolidating above it. Will it hold or not will depend largely on fundamentals and the risk on/off sentiment.
This time we show the daily timeframe with the key technical levels to watch for the week.
The 61.8% Fib retracement is still a key support level at 110.50 (S1), below it, the 200-day moving average (red line) at 109.80 (S2) and the previous lows at 109.20 (S3) are the next support levels.
The 100-day moving average (orange line) at 112.70 (R2) and the highs at 114.40 (R3) will act as resistance in case the previous support – now resistance at 112 (R1) is broken to the upside.
USD/JPY Daily chart – Consolidating around the 50-day moving average
