US Dollar Fundamental Outlook – Fed Hikes Rates and Announces Unwinding of Balance Sheet:
The US dollar had another volatile FOMC week, but in the end, the dollar index finished unchanged from where it opened the week.
The FOMC and Chair Yellen sent a clear hawkish message to the market by raising interest rates for the second time this year, projecting another rate hike till year-end, and announcing the beginning of the reduction of the Fed’s balance sheet.
Even though this was the most bullish outcome of the Fed meeting, the USD will still likely have a hard time to march higher anytime soon. The reasons for that are lower inflation expectations, especially after the big miss in the CPI last week. So, despite the Fed’s projections for another rate hike till year-end, the market is not believing it so far, and as long as that remains so, the US dollar will have a hard time to move notably higher.
No major events are on this week’s calendar from the US.
Euro Fundamental Outlook – PMI Reports Need to Prove Further Strength in the Economy:
The euro continues to hold up well as the market is preparing for a policy shift at the ECB. Unlike as is the case for the Fed, the markets want to believe that the ECB will start the tapering of the asset purchase programme toward the end of this year and that’s mainly what’s keeping the euro firm.
This Friday’s manufacturing and services PMI reports will be important in this regard as continued strength in the economy will be required for the ECB to proceed with the tapering process. If the PMIs fall short of expectations then EUR/USD will likely slide toward 1.10.
EUR/USD Technical Outlook:
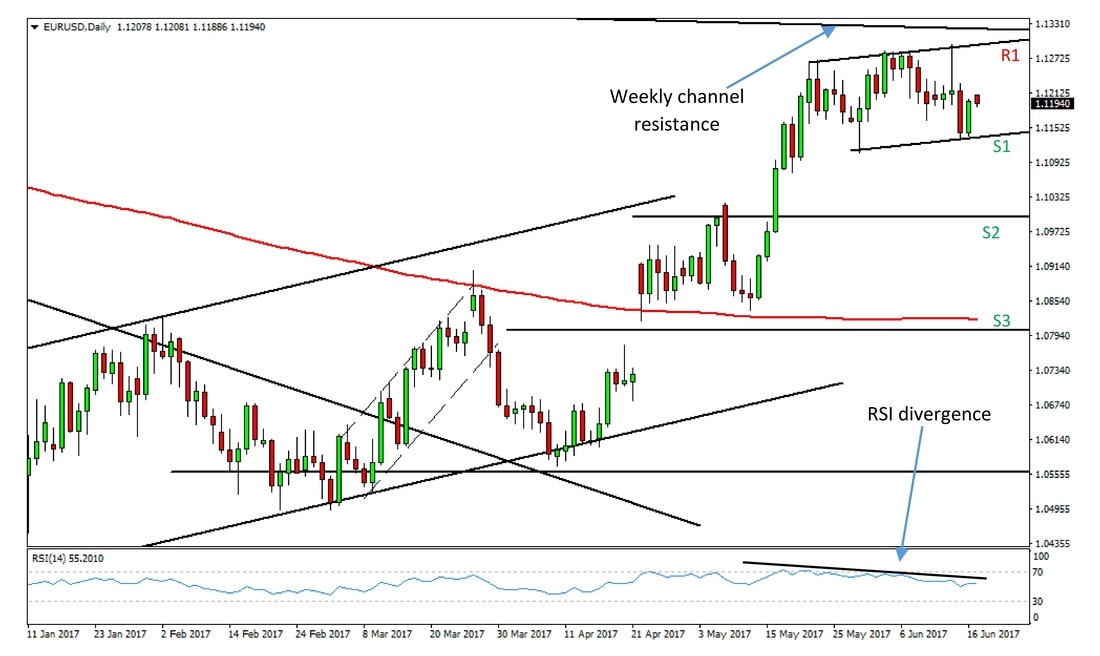
The technical situation on the daily chart remains largely the same with last week’s with a few important differences.
First, the highs near 1.13 (R1) were once again rejected, this time stronger with a large shadow of Wednesday’s Pin Bar candle followed by Thursday’s bearish engulfing candlestick pattern.
Second, the formation of a slightly rising – near horizontal channel has been confirmed.
This suggests that price action is likely to stay in this rising channel for a while before breaking in either direction. A breakout either way would be a nice trading opportunity.
A break below the 1.1140 – 1.1150 area (S1) will most likely mean that EUR/USD will head lower for a deeper retracement toward the strong support at 1.1000 (S2).
A break through 1.1000 will open the way to the 1.0800 support (S3) where the 200-day moving average and 61.8 Fibonacci retracement meet.
EUR/USD Daily chart – Watching the channel
British Pound Fundamental Outlook – Brexit Negotiations Start This Week
The Bank of England surprised traders last week by issuing a more hawkish than expected rate statement and having 3 members of the committee vote for a rate hike instead of only 1 expected.
Sterling flew high after the release of the decision but failed to follow through with any gains as political uncertainty looms.
And indeed, politics will remain the center of attention in the UK. Brexit negotiations start this week, and with Theresa May’s position weaker than she originally anticipated the chances for a difficult start of talks seem high.
This supports a weaker pound, but still, where GBP is headed is hard to say as Brexit headlines are set to determine how the currency will trade this week. One thing is certain though – volatility in GBP pairs.
GBP/USD Technical Outlook:
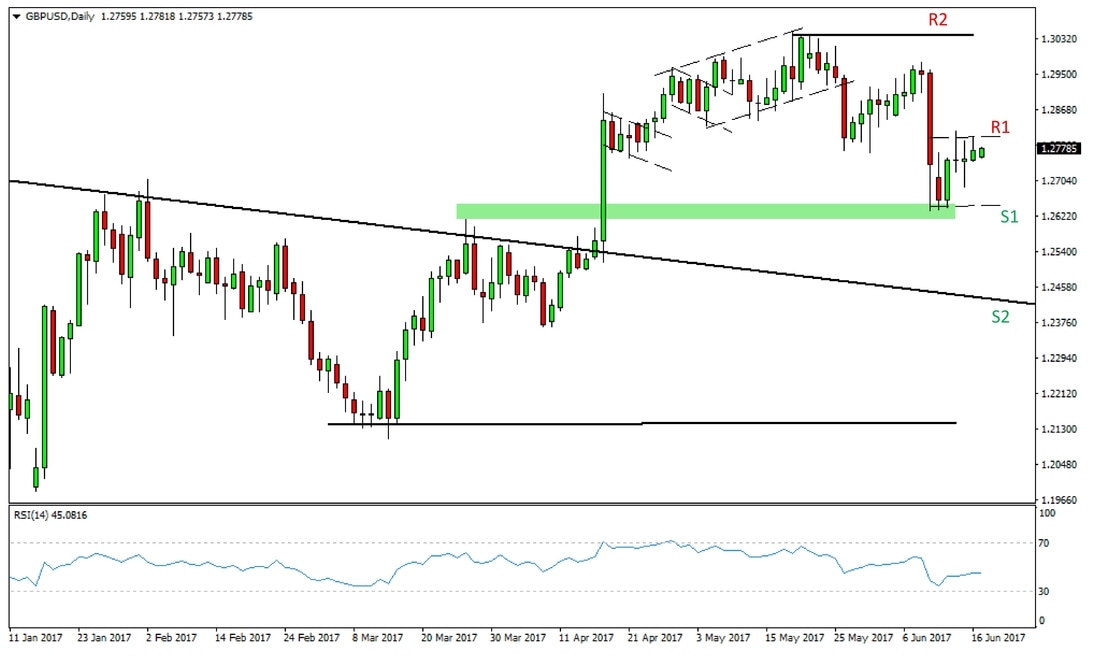
As noted in the Fundamental outlook, Brexit talks will now dominate how GBP/USD trades. For that reason, it’s important that we are aware of key technical levels as the market will very often respect them even in highly volatile times. However, keep in mind that technical setups like chart patterns are more likely to fail when strong fundamentals are the main force of market moves.
Currently, GBP/USD is trading in a post-election range between 1.2650 (S1) and 1.2800 (R1). Which way this range breaks out will be important and will likely mean the pair is either headed for 1.3000 – 1.3050 (R2) or 1.2400 – 1.2450 (S2).
GBP/USD Daily Chart – Sideways for now
Japanese Yen Fundamental Outlook – BOJ Remains Dovish:
The Bank of Japan maintained its dovish policy stance by re-affirming its yield curve targeting policy and quantitative easing program until inflation is headed back toward the 2% target.
This should keep the yen on the backfoot this week and in the near term, however, political tensions are one risk factor to this scenario.
In fact, risk appetite and risk aversion will continue to be the main factors for where the Yen will be trading, with the currency likely to fall on rising risk appetite and strengthen in times of risk aversion.
USD/JPY Technical Outlook:
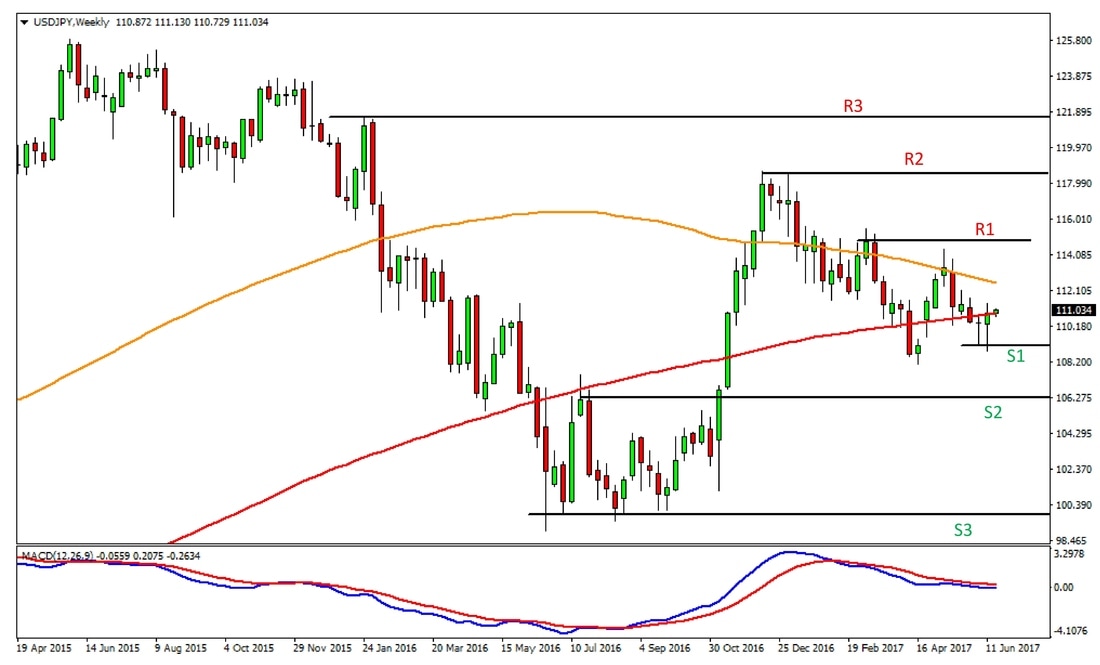
A bullish morning star candlestick pattern is now in place on the USD/JPY weekly chart. The long shadows of the pattern suggest that at least a near-term bottom is now confirmed at the lows of the pattern around 109.00 (S1).
A move toward 115.00 (R1) now seems likely, still, traders need to be aware of the 100-day MA (112.50 – orange line) and 200-day MA (110.90 – red line) which stand on the way to 115.00 and may stop any advance.
Longer-term, 106.00 – 106.50 (S2) and 100.00 (S3) are strong support zones to the downside, while the high at 118.50 (R2) should provide resistance to higher prices.
