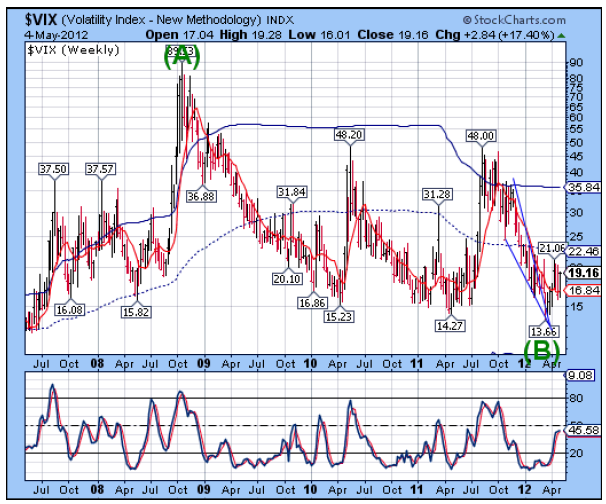
After three weeks of testing the 10-week moving average at 16.84, the VIX is now ready for a breakout, not just above weekly Mid-Cycle resistance at 22.46, but Cycle Top resistance at 35.84 as well. The powerful rally that I have been predicting is ready to begin. The VIX may be above its Cycle Top resistance (35.84) by May 15.
SPX closed below its 10-week moving average
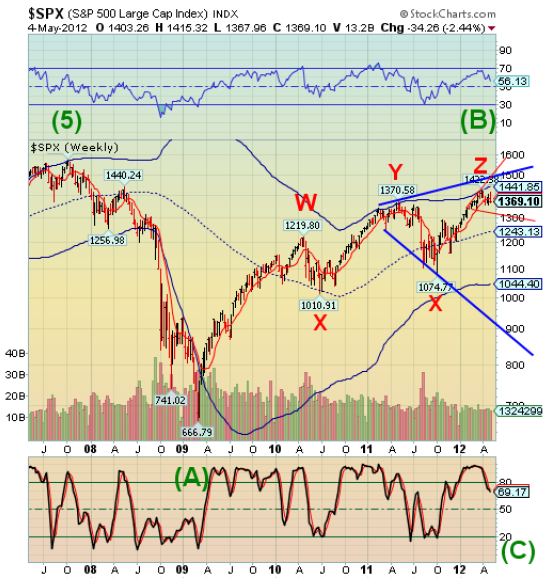
The SPX closed below the 10-week moving average at 1386.96. The back-and-forth testing of the 10-week line indicates the loss of support at that area. The appearance of the Orthodox Broadening Top at hourly, daily and weekly degrees is a harbinger of a Flash Crash that could take the SPX to its Cycle Bottom at 1044.40 in very short order. There are some indications that the large, blue Orthodox Broadening top may get involved with this decline with further bearish implications.
(ZeroHedge) Months of hope that the economy could finally start a 'virtuous cycle' were once dashed in a puff of smoke, after the jobs report came and cemented that the economy is now rolling over and picking up speed to the downside. Only this time, in a very ominous
development for the permabulls, the MORE QE IS COMING, BUY ON DIPS crowd was nowhere to be seen. Why?
NDX is at a “mini crash trigger.”
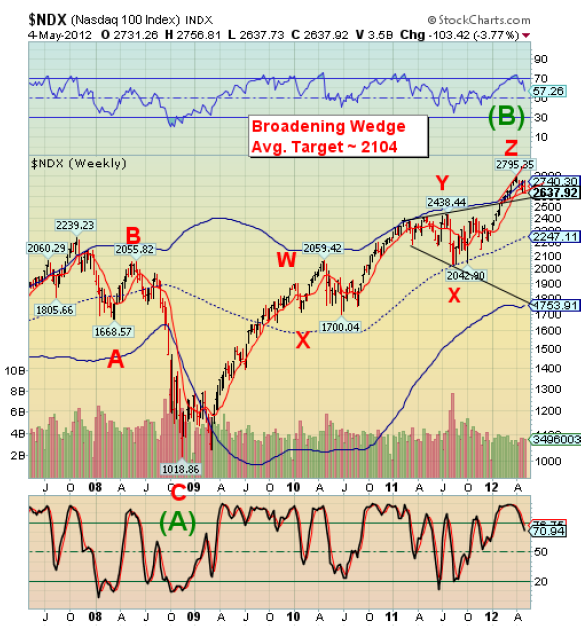
The NDX closed right at its “crash trigger,” the lower trendline of a small Broadening Top formation. The Broadening Wedge (red) indicates that once NDX drops below it, the initial decline may quickly decline an average of 20% with a target near 2100.00. This Master Cycle may be in overtime, as it was last July. Most cycle practitioners believe that a right-translated cycle may offer only a mild decline. Last year’s Broadening Top says differently. This year the cycle is stretched again. The cycle profiles in virtually all assets suggest something dramatic is about to happen.
The Euro is approaching its “crash Trigger.”
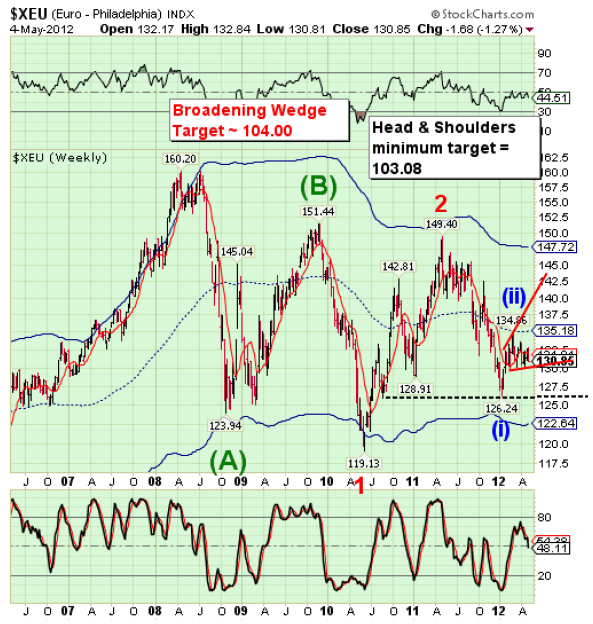
The Euro consolidation is taking the form of a small Head & Shoulders pattern sharing the trendline of its Broadening Wedge formation. It closed on Friday below its 10-week moving average at 131.81. A decline below its trendline at 130.00 will confirm the resumption of the downtrend by triggering both patterns. This will be enough to trigger the larger Head & Shoulders neckline at 126.24 with a minimum target near parity for the Euro. This combination of formations presages a crash in the Euro with an average target near 100.00.
(ZeroHedge)… as Barclays notes, if European banks follow the same trajectory as Japanese banks did from their peak in 1993 (as Europe has been since their peak in 2006), then Europe's banks market cap as a percentage of the total market is likely to drop from the current 11% to around 6% within the next year.
The US Dollar may be ready to leap higher.
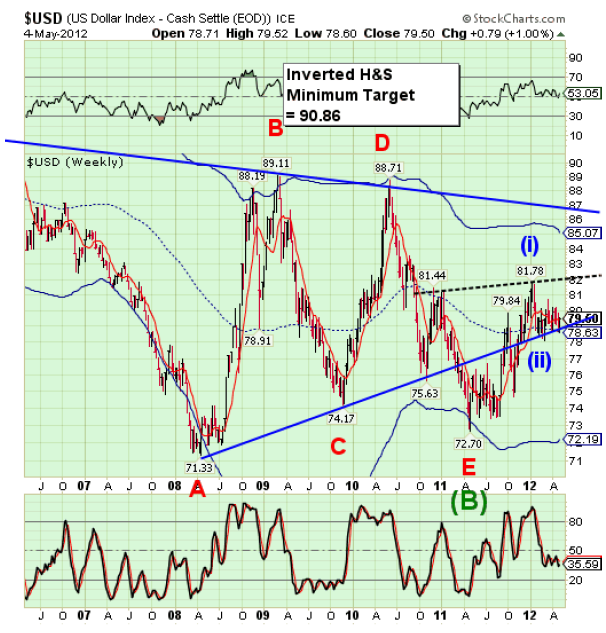
The US Dollar spent four weeks consolidating above its triangle trendline and has finally found support at weekly mid-cycle support at 78.63. It closed above 10-week support at 79.49, as well. There have been several cycle inversions, but the latest inversion sets up $USD for a Primary Cycle high near May 15. Primary Cycles often build on the strength of the previous Trading Cycle, so this one may be a barn burner.
Gold is pressing down at a minor Head & Shoulders neckline.
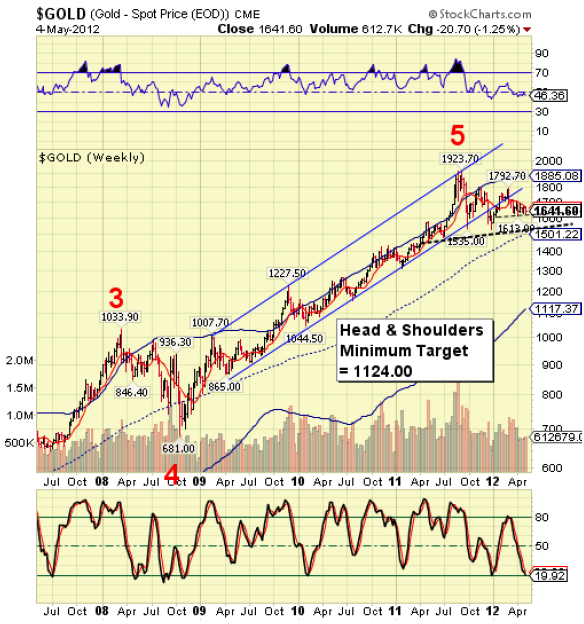
Gold has continued to dwell beneath its 10-week moving average, currently at 1665.11, which appears to be pushing it into a mini-Head & Shoulders pattern at 1620.00. It has a minimum target of 1447.00, which would violate the massive Head & Shoulders pattern seen in the chart. This could trigger yet another cataclysmic decline toward the Cycle Bottom show in the chart.
(ZeroHedge) While Becky Quick's CNBC interview with the Charlie Munger has a little for everyone to love and hate (from Keynesian-doctrine to easy-living-Greeks and Bad-trading-robots), Buffett's right-hand was particularly eloquent in his views (at around 9:08) on Einhorn's distrust of the Fed and buying Gold: "gold is a great thing to sew onto your garments if you're a Jewish family in Vienna in 1939 but civilized people don't buy gold - they invest in productive businesses." End quote.
U.S. Bonds have broken above its triangle pattern.
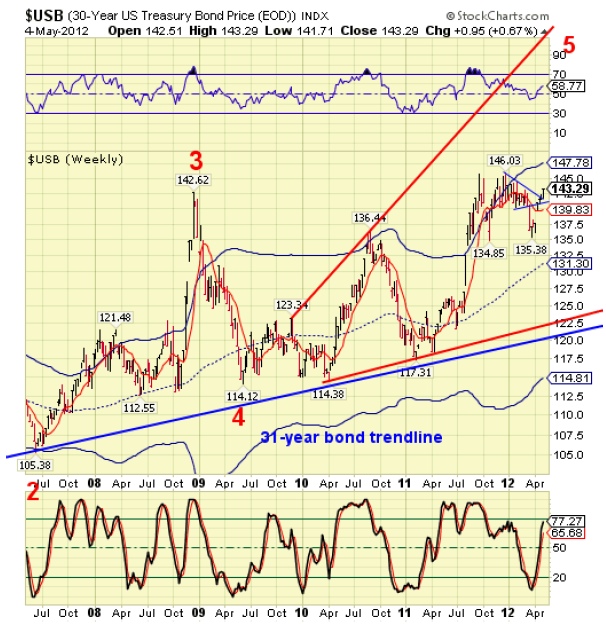
The USB continued its rise above its 10-week moving average at 139.83. USB has started its launch above the triangle formation to its Cycle Top resistance at 147.78. It may go much higher, if a panic in equities causes a parabolic blow-off in treasuries. Let it be known, however, that this will be the final rally to a 30-year top.
(ZeroHedge) …the Treasury Borrowing Advisory Committee (basically Goldman Sachs and JP Morgan, and the rest of the buy and sell side) did indeed come out with a unanimous decision, having decided to recommend FRNs (Floating Rate Notes). This simply means that Wall Street is either desperate to telegraph a surge in short-term rates, or, even worse, if actually anticipating a surge in short-term rates and is doing all it can to hedge before it happens.
Crude begins its decline.
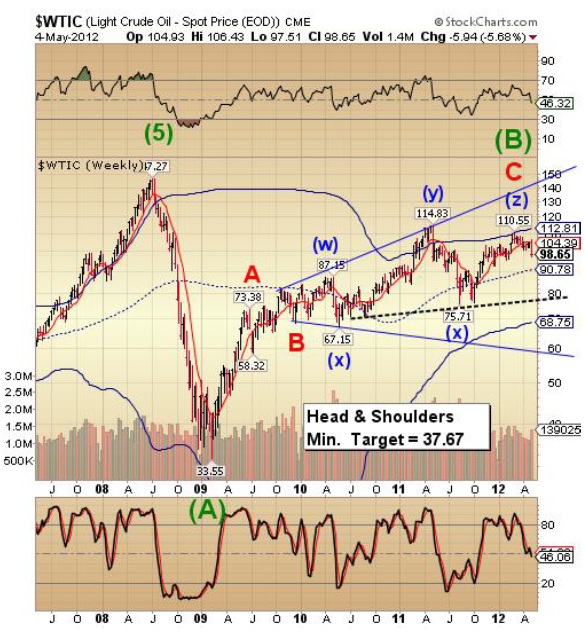
West Texas Crude broke down out of its narrow trading range. This may be the beginning of a fall as far as Cycle Bottom support at 68.75 and possibly in a flash crash in the coming Master Cycle low. This may also trigger the Head & Shoulders pattern near 79.00.
(Bloomberg) Crude oil for June delivery tumbled $4.05 to $98.49 a barrel on the New York Mercantile Exchange, the lowest settlement since Feb. 7. It was the biggest one-day drop since Dec. 14 and capped a 6.1 percent decline for the week, the most since September.
China stocks are finishing their retracement.
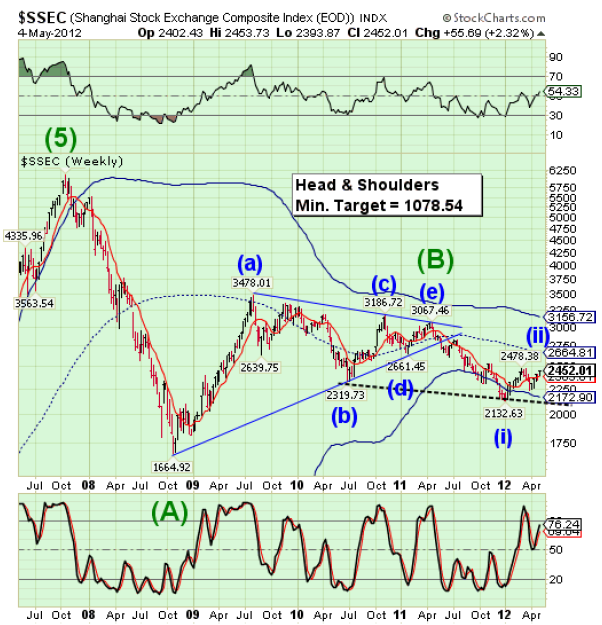
--The Shanghai index remained above its 10-week moving average at 2383.81 this week and appears to be extending its retracement to form a flat top by early next week. A reversal below its 10-week line would trigger a new sell signal. The next level of support is the Cycle Bottom support at 2172.90, which would give way to the Head & Shoulders neckline at 2125.00.
This may put the Shanghai in the position of losing about half of its value in the next decline, which may start next week and may last another two months. It appears that the Shanghai Index may be leading world equities in their decline. Michael Pettis revisits 12 predictions on China. .
The India Nifty has broken all support.
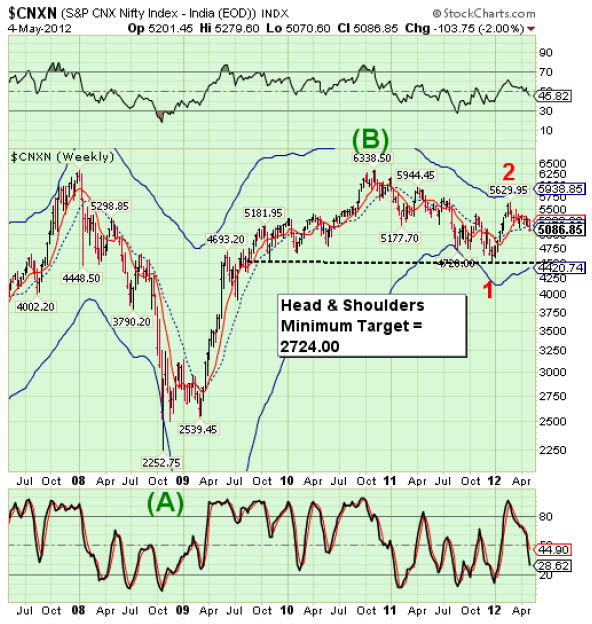
The India Nifty has begun to decline below mid-cycle support at 5179.80 and its 10-week moving average at 5268.32. The sideways consolidation is over. The next objective is a test of the Head & Shoulders neckline and may bring downside acceleration to the India 50 index. The Cycles Model suggests that the Head & Shoulders neckline may be broken by May 15.
The Bank Index breaks below its Bearish Wedge.
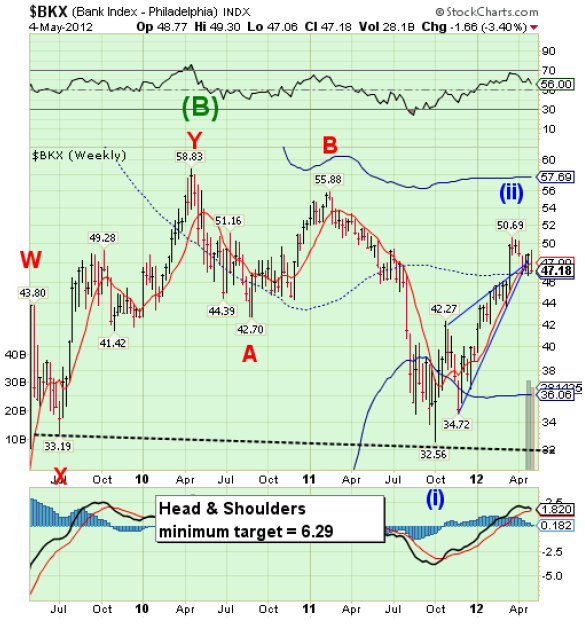
BKX tested mid-cycle support at 46.88, but hasn’t yet declined beneath it. It has declined below its 10-week m.a. at 47.99 and is now on a confirmed sell signal. The Bearish Wedge formation is now violated andmay cause a plunge beneath the neckline very quickly. Bearish Wedges are always completely retraced. Right beneath the Bearish Wedge formation is an enormous Head & Shoulders pattern. The intial decline to or beneath the Head & Shoulders neckline may take place no later than mid-May.
(ZeroHedge) There is hardly any more long-suffering investor in this market than anyone who has held the stock of that worst of breed American bank: Bank of Countrywide Lynch (BAC), which following the worst M&A transaction in history, namely its purchase of Countrywide, has found out that one does not pay billions for hundreds of billions in contingent liabilities, which will manifest themselves in tens of billions in putback claims against the underreserved bank over time.
