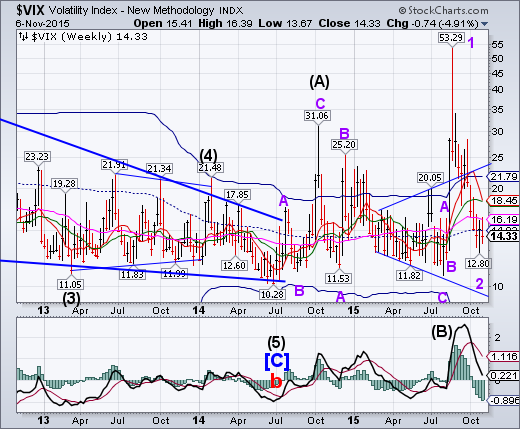
VIX challenged its weekly Short-term resistance at 16.19, then closed below its weekly mid-Cycle support at 14.92, postponing the weekly buy signal. The Broadening pattern “throwback” inside the Megaphone appears to be complete. The next move calls for a breakout to new highs. While traders are anticipating a calmer season ahead, the VIX warns the opposite may happen.
(ZeroHedge) "The options market seems to either be anticipating an inflection higher in the economic data, no rate hike, or an extreme lack of catalysts between now and year-end," according to Goldman Sachs (N:GS)' Krag Gregory. With VIX trading with a 13 handle, Gregory warns, it is notably under-priced relative a 19 handle more in line with economic and policy uncertainty. The potential for volatility to swing higher seems more likely.
SPX stalls above Long-term support.
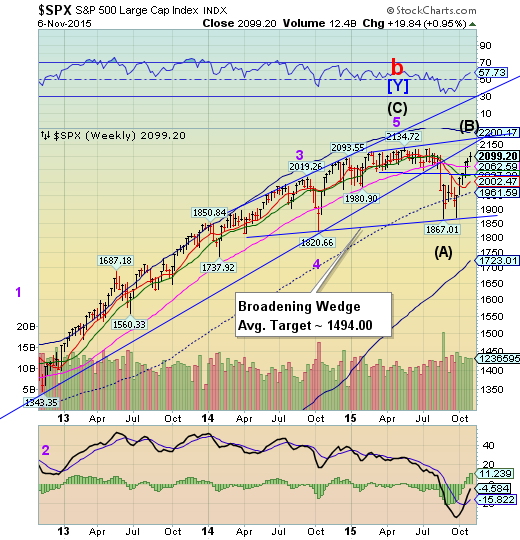
The SPX appears to have peaked on Tuesday at 2116.48, then eased back to close with a weekly gain. This may have been the Pivot reversal that the Cycles Model called for. There are two Broadening Wedge formations, one within the other. These are known as Fractals, which are often repetitive and self-similar. A follow through on the probable reversal may see Long-term support at 2062.59 broken, followed by the Broadening Top trendline. A break of the trendline may lead to a flash crash much larger than the last.
(Bloomberg) The specter of higher interest rates is losing its ability to spook U.S. equity investors.
Growing conviction that a pillar of the six-year bull market will be taken down did little to slow a rally that’s added 12 percent to the Standard & Poor’s 500 Index since August. Equity benchmarks rose for a sixth week, even as the best monthly employment report of the year pushed odds for an interest-rate hike in 2015 to 70 percent.
NDX makes a new high.
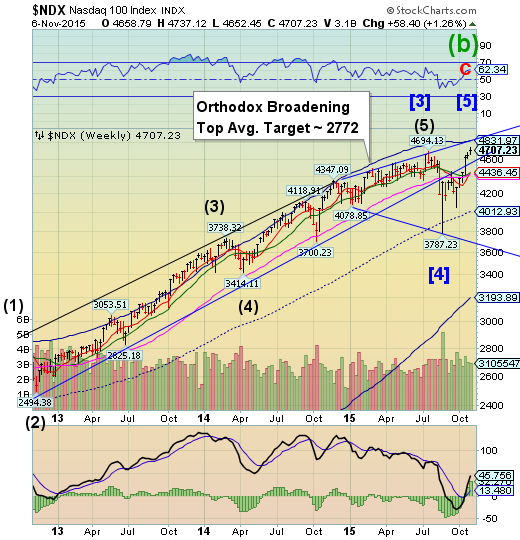
NDX bettered its July 20 high by 42 points. However, the expected Pivot reversal may have arrived on Tuesday, as well. A decline beneath weekly Long-term support at 4436.45 may offer a sell signal. A further decline beneath the trendline at 3700.00 may trigger the Orthodox Broadening Top formation.
(IBD) With strong quarterly reports out this earnings season, some big tech stocks have been hitting new highs. Google (O:GOOGL) owner Alphabet, Amazon, Facebook (O:FB), Microsoft (O:MSFT) and Priceline (O:PCLN) have all reached new high ground in the last couple days.
E-commerce giant Amazon.com (NASDAQ:O:AMZN) is an IBD Leaderboard stock and has powered up three days straight, to as high as 662.26 on Friday. The stock is now well overextended past a 549.88 buy point. Amazon's quarterly report last month showed, by one analyst's tally, that it's responsible for about 20% of U.S. online retail sales. By another tally it accounted for about a third of all North American retail sales growth volume in the first nine months of the year. Amazon has also grown into a powerhouse in online video streaming and cloud computing.
Others aren’t so sanguine.
High Yield Bonds closes the week flat.
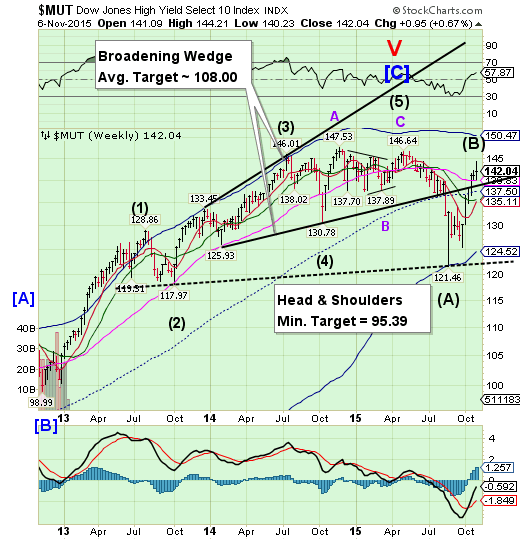
The High Yield Index also peaked on Tuesday before sagging to close nearly flat for the week. A drop back beneath the trendline may trigger the Broadening formation, leading to a potentially substantial decline. The Cycle Bottom/Head & Shoulders neckline may be challenged again.The Cycles Model suggests a major decline in HY over the next month.
(MarketRealist) Investor inflows for high-yield bond funds remained positive throughout October after the net outflows witnessed in September. According to Lipper, net inflows for high-yield bond funds totaled $7.6 billion through October 28, compared to outflows totaling $1.9 billion in September. Due to these massive inflows, high-yield bond funds have witnessed inflows to the tune of $1.6 billion on a YTD (year-to-date) basis. High-yield bond funds had been witnessing outflows on a YTD basis from the week ending July 29 until the week ending October 21.
The euro triggers the Bearish Flag formation.
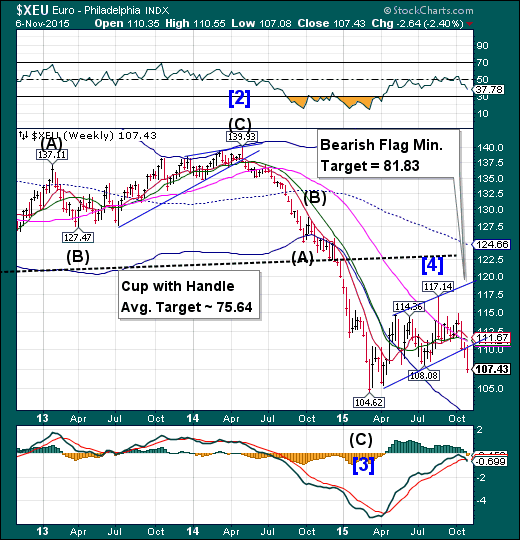
The euro triggered its bearish Flag formation this week, breaking below its July low. It is probable that the euro trend toward parity with the USD may continue, as the next technical support lies at 101.39. The Cycles Model suggests the euro may decline over the next three weeks.
(CNBC) The euro versus the U.S. dollar hitting $1.0843 Wednesday reignited a debate among traders over whether the currency will trade in parity with the dollar before the end of the year.
The eurozone currency has been steadily moving down on European Central Bank President Mario Draghi's dovish commentary. Wednesday, the euro reacted to hawkish comments from Fed Chair Janet Yellen, suggesting a U.S. central bank rate hike could come in December.
EuroStoxx challenges Long-term resistance.
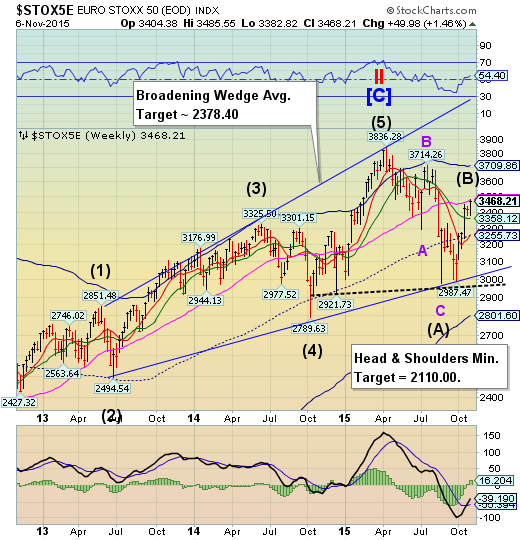
EuroStoxx 50 challenged weekly Long-term resistance at 3482.06, but closed beneath it. A loss of Intermediate-term support at 3358.12 may be problematic, as a further decline to weekly mid-Cycle support at 3255.73 may be forthcoming. Should that occur, EuroStoxx may remain in a decline through the end of the year.
(Bloomberg) European stocks advanced as better-than-expected U.S. jobs data fueled the possibility of a Federal Reserve rate hike this year, weakening the euro currency and boosting the attractiveness of exports from the region.
Germany’s DAX Index was among the biggest gainers of western-European indexes, with BMW AG (DE:BMWG) and HeidelbergCement AG (DE:HEIG) adding at least 2.2 percent. Cie. FinanciereRichemont SA (VX:CFR) slid 5.7 percent, leading a gauge of personal-and-household goods stocks to among the worst performances on the Stoxx Europe 600 Index, after the owner of Cartier and Montblanc forecast a challenging end to its year amid a slump in demand for watches in Asia. Swatch Group AG (VX:UHR) and LVMH Moet Hennessy Louis Vuitton SA (OTC:LVMUY) fell at least 2.7 percent.
The yen breaks beneath support.
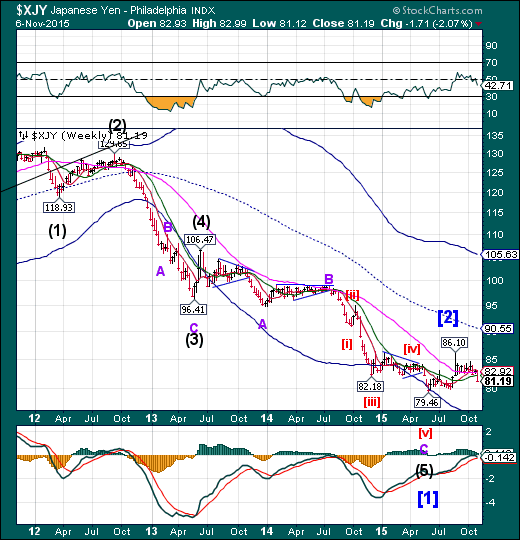
The yen broke beneath Long-term support at 82.92, giving a green light to additional declines. The Cycles Model suggests the yen may decline over the next two weeks or more, in anticipation of a Master Cycle low in late November.
Investing.com - The dollar was higher against the euro and the yen on Friday, as investors eyed the release of U.S. employment data later in the day amid growing expectations for a December rate hike by the Federal Reserve.
The Nikkei challenges Long-term resistance.
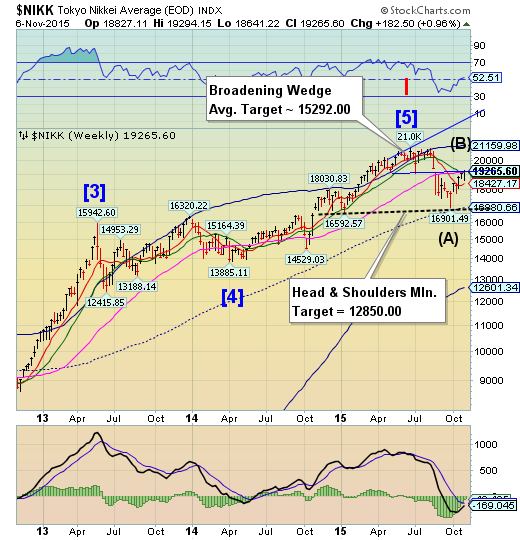
The Nikkei challenged its Broadening Wedge and Long-term resistance at 19243.12, closing above both. Broadening formations allow throwbacks before the final decline, which may reach their targets. The Cycles Model allows another week or more of rally before a probable reversal. Should the subsequent decline go beneath mid-cycle support at 16980.66, the Nikkei may experience a flash crash taking it to its cycle Bottom support at 12601.34.
(JapanTimes) Stocks gained ground on the Tokyo Stock Exchange on Thursday as the yen weakened, with the Nikkei average finishing above 19,000.
The Nikkei rose 189.50 points, or 1.00 percent, to end at 19,116.41. On Wednesday, it jumped 243.67 points.
The Topix advanced 14.67 points, or 0.95 percent, to 1,555.10, after rising 13.46 points the previous day.
Buying took the upper hand from the outset of Thursday’s trading, leading the Nikkei average to open above 19,000.
U.S. dollar is approaching Round Number resistance.
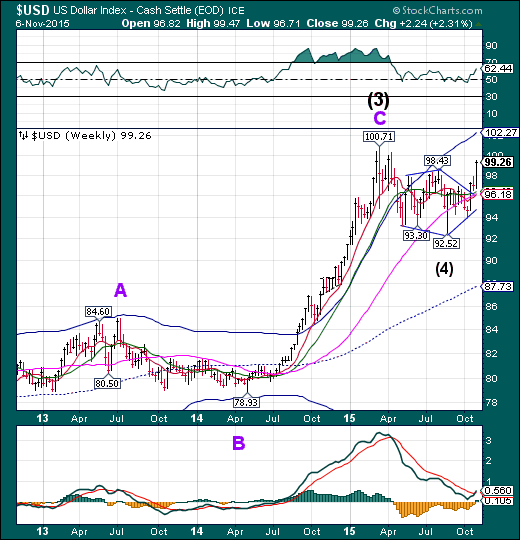
The US dollar is approaching Round Number resistance and its prior high at 100.00. This may call for an imminent pullback to Long-term support, currently at 96.18. The Cycles Model calls for a Master Cycle low near the end of the month.
(Reuters) The dollar jumped to a seven-month high on Friday, pushing oil prices lower, and short-term U.S. bond yields rose to the highest in five years after strong U.S. jobs data bolstered expectations the Federal Reserve will raise interest rates in December.
Nonfarm payrolls increased 271,000 in October, the largest gain since last December, while average hourly earnings rose a respectable 9 cents, the U.S. Labor Department said. The unemployment rate fell to 5.0 percent, the lowest since April 2008 and in a range many Fed officials consider to be full employment.
The robust report boosted the likelihood the Fed will raise rates before year's end, which would be the first increase in almost a decade and end seven years of easy monetary policy.
USB is at the Broadening Wedge trendline.
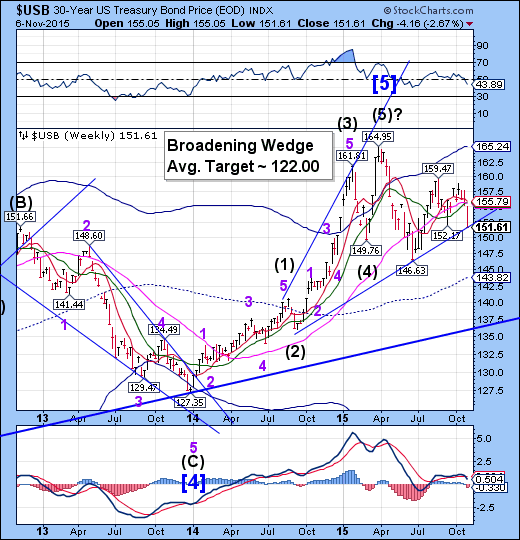
The Long Bond closed at the Broadening Wedge trendline at 151.50. USB now has the potential of forming a Master Cycle low at the trendline or declining beneath it, putting the long-term trend in jeopardy. The 34-year trendline lies at 136.25.
(WSJ) Yields on short-term U.S. government debt rose to a five-year high Friday after a strong employment report solidified expectations of a possible interest-rate increase by the Federal Reserve in December.
Investors lightened up on bonds, concerned that the value of their bond holdings would shrink by a shift in the Fed’s ultra-loose monetary policy. The yield on the benchmark 10-year Treasury note also rose to the highest level since July. Yields rise as bond prices fall.
Bond yields have been rising since Oct. 28 when Fed officials signaled that they were on course to tighten monetary policy before the end of the year. Fed Chairwoman Janet Yellen said Wednesday that December is a “live possibility.” Federal Reserve Bank of St. Louis President James Bullard said Friday he believes the U.S. economy is ready for a boost in borrowing costs.
Gold is challenging its Cycle Bottom.
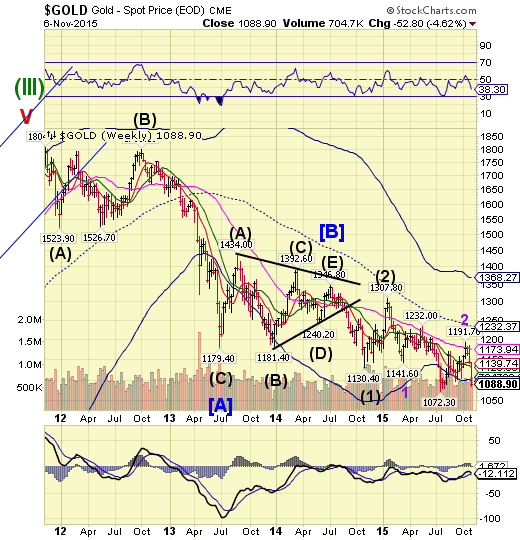
Goldis challenging its weekly Cycle Bottom at 1096.46, but hasn’t broken beneath its July low at 1072.30. It is due for a Trading Cycle low by the end of the coming week, which may also qualify as an early Master Cycle low. The Cycles Model suggests an alternate pattern that may still bring a short bounce next week, but a more sustained low at the end of November or early December. A decline beneath 1072.30 may bring on the alternate view.
(WSJ) Gold prices fell on Friday after some investors wagered that the strong U.S. employment report increases the likelihood that the Federal Reserve will soon tighten monetary policy.
The most actively traded gold futures contract, for December delivery, fell $16.50, or 1.5%, to settle at $1,087.70 a troy ounce on the Comex division of the New York Mercantile Exchange. This was the lowest close since Aug. 5.
Prices have stumbled in recent days after Fed officials surprised traders by signaling higher rates remained a possibility for 2015. While some investors had previously wagered that the U.S. central bank would delay raising rates until 2016 in response to the recent weak economic data, they shed gold holdings in response to the hawkish communique.
Crude loses the challenge at Intermediate-term resistance.
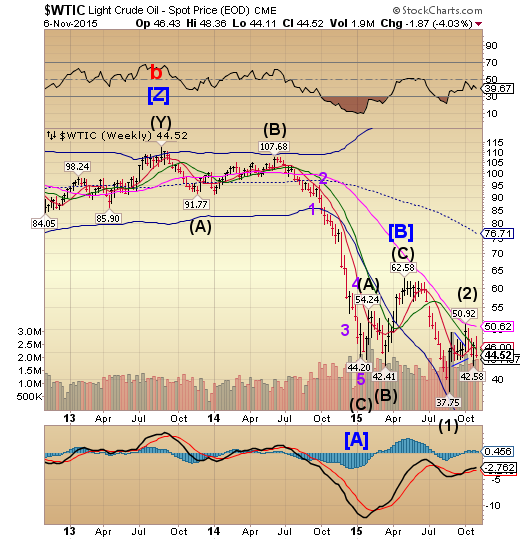
Crude challenged Intermediate-term resistance at 46.00, but lost the fight, as suggested last week. This makes the new Master Cycle extremely left-translated and bearish. The Cycles Model suggests that crude may be at new lows by the end of November.
(UPI) -- Data showing a continued slowdown in the upstream side of the energy sector pushed crude oil prices well below their midweek peaks in early Friday trading.
Oil prices started the week trending lower after Russia reported a steep rise in crude oil production from last year. Crude oil prices surged in Tuesday trading as labor strikes gripped much of the Brazilian oil sector, though the rally fizzled late in the week amid signs markets still favored the supply side.
Crude oil prices have moved consistently lower as weak economic growth balances against an increase in production, largely from U.S. shale oil basins. That's left energy companies with less capital to invest in exploration and production, a trend reflected in monthly counts of active drilling rigs.
Shanghai Index rises above resistance.
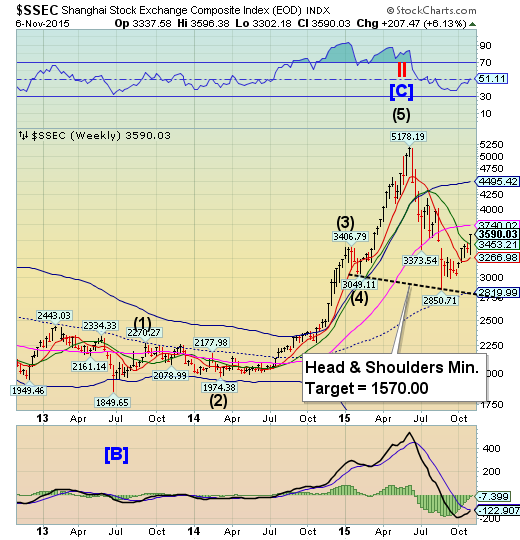
The Shanghai index rose above Intermediate-term resistance at 3453.21, taking aim for Long-term resistance at 3740.02. Many times a probable Pivot day meets support or resistance, creating a reversal. Last week apparently was not a significant one. The next probable Pivot occurs by the end of the week, making Long-term resistance the next target.
(ZeroHedge) It’s no secret that Beijing has an excess capacity problem.
Indeed, the idea that a years-long industrial buildup intended to support i) the expansion of the smokestack economy, ii) a real estate boom, and iii) robust worldwide demand ultimately served to create a supply glut in China is one of the key narratives when it comes to analyzing the global macro picture. That, combined with ZIRP’s uncanny ability to keep uneconomic producers in business, has served to drive down commodity prices the world over, imperiling many an emerging market and driving a bevy of drillers, diggers, and pumpers to the brink of insolvency.
As we noted late last month, if you want to get a read on just how acute the situation truly is, look no further than China’s "ghost cities"...
The Banking Index reverses below Long-term resistance.
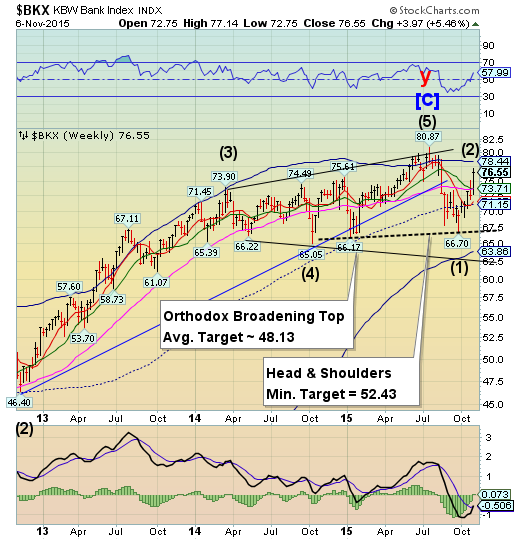
BKX rallied above Long-term resistance at 73.73, completing a 74% retracement of its initial decline. There is no tangible sign of a reversal yet, so there is a probable target at the Cycle Top at 78.44 should the rally extend into mid-week or later.
(ZeroHedge) As central planners the world over grapple with the effective “lower bound” that’s imposed by the existence of physical banknotes, there’s been no shortage of calls for a ban on cash.
Put simply, if you eliminate physical currency, you also eliminate the idea of a floor for depo rates.
After all, if people can’t withdraw paper money and stash it under the mattress, then interest rates can be as negative as the government wants them to be in order to “encourage” consumption.
(TheAtlantic) It’s now seven years since the subprime mortgage crisis, but both regulators and the public are still concerned about Wall Street’s ethics. And they have good reason to be: One of the largest surveys ever done on the financial-services industry showed that ethical breaches are abound.
This past week, the president of the New York Federal Reserve William Dudley hosted a closed-door conference with some of the world’s biggest banks to encourage them to do more to clean up bad behavior in the financial sector. Dudley warned that not only has public trust eroded in light of various scandals, but that the unethical culture within banks is a possible source of instability.
(ZeroHedge) Back in May, the ECB's Benoit Coeure told a non-public audience of hedge funds in London that "the central bank would moderately front-load its purchases in its quantitative easing program because of the seasonal lack of market liquidity in the summer."
The reaction was a 50 pips drop in EUR/USD.
The problem: this was inside information. It wasn’t released to the trading public until around 8am the next day (London time) when it resulted in a further 150 pip plunge.
