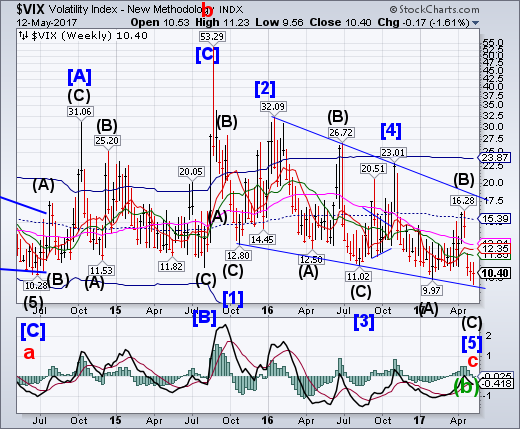
VIX appears to have made its final decline to a new low on May 9. This may be the Super Cycle low in volatility. A reversal is now overdue. An actual change in long-term trend may occur above the top trendline of the 16-month long Ending Diagonal formation near 17.50.
The most profitable short trade in town has been a gift that keeps giving. To be precise, it’s had an eye-popping surge of more than 4,000 percent since the start of the bull run in 2009. That allure has been enticing investors to jump on the gravy train.
That gift, selling volatility, is so crowded now that when everyone reaches for the exit, it’s bound not to end well.
SPX makes a new high.
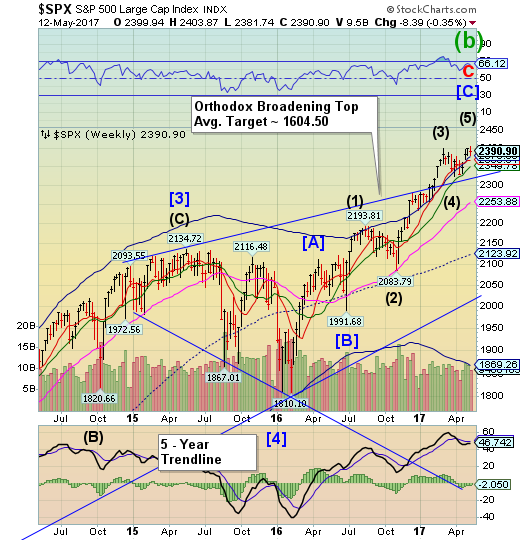
SPX made a new all-time high on Tuesday, barely 3 points higher than the March 1 top and two days past a Pi Cycle from the Brexit low. The Cycle appears to be overdue for a reversal. The DJIA does not confirm the new SPX and NDX highs. The risk parity model which has been a major driver of this rally appears to be losing its energy.
CNBC's Mike Santoli spoke with Arnott in an exclusive interview for CNBC PRO. Santoli asked the fundamental indexing pioneer about his market outlook. Arnott said:
Our global asset allocation work is giving some pretty stark indications. We like to look at what we call a Shiller PE ratio, price relative to 10-year smoothed earnings. U.S. is at 29 times earnings. The markets have been higher than those levels twice in history, the tech bubble and 1929. That's not very pleasant company to keep. I'd be very worried about US equities.
NDX also makes a new all-time high.
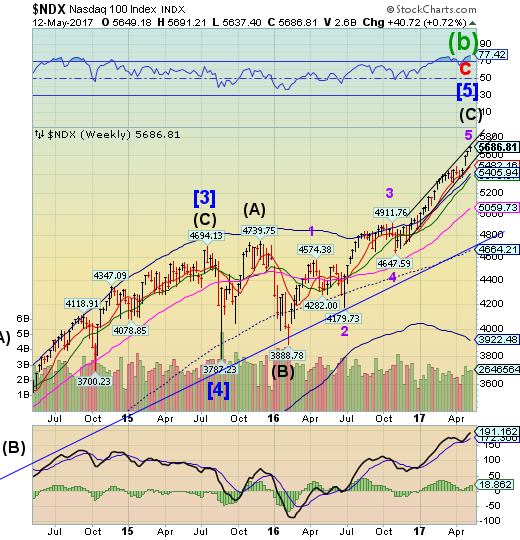
NDX posted another new all-time high on Tuesday. It is clearly on an extension with earnings playing a big part of the ebullience. Wave relationships suggest thatWave 5, at 150% the length of Wave 1, may be complete. A decline beneath Short-term support and the trendline at 5482.46 may suggest a deeper correction is in order.
Over the past 10 weeks – so since March 1, 2017 – five stocks in the S&P 500 index have gained a total of $260 billion in market value, the infamous FAANG stocks: Facebook (NASDAQ:FB), Apple (NASDAQ:AAPL), Amazon (NASDAQ:AMZN), Netflix (NASDAQ:NFLX), and Google (now Alphabet (NASDAQ:GOOGL)).
By any measure, $260 billion is a massive surge in valuation for just five stocks, or 1% of the S&P 500, in just 10 weeks.
And the rest of the S&P 500? On March 1, the index closed at 2,394. Today it closed at 2,397. In those 10 weeks, it went absolutely nowhere. Which means this: the remaining 495 stocks in the index lost as much in total market capitalization as the FAANG stocks gained.
High Yield Bond Index ready to challenge Long-term support.
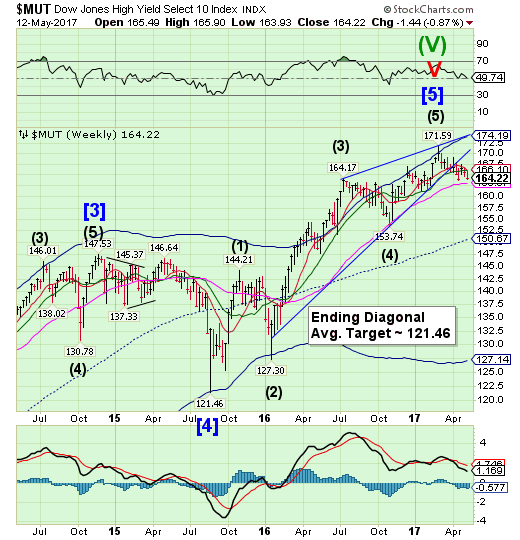
The High Yield Bond Indexdeclined toward long-term support at 163.07, the last bastion of defense against a bear market.It remains on a sell signal.Should MUT decline beneath Long-term support, the Cycles Model suggestsacceleratedweakness ahead that may last through the end of May.
Global bonds have been roiled by improving growth prospects, but in one of the riskiest parts of the market, junk-rated credit, yields are still falling to all-time lows.
That has left this market looking expensive to some investors, particularly given the potential for central banks to tighten monetary policy and trigger a selloff.
In Europe, yields on junk-rated bonds hit their lowest level on record this week. U.S. high yield is also outperforming other bonds, with yields falling toward the lows reached in mid-2014.
USB at multiple supports.
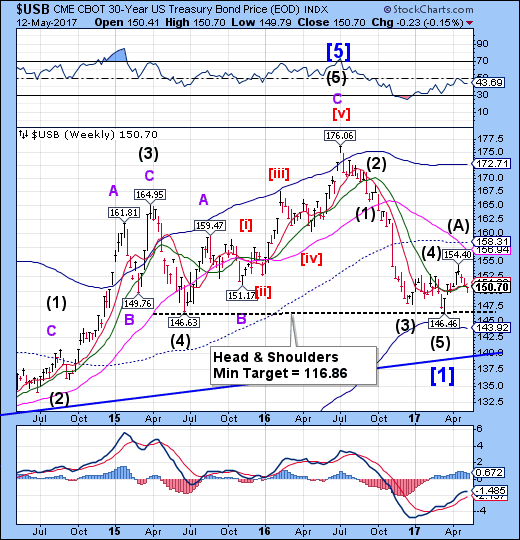
The Long Bond has slipped beneath Intermediate-term (150.74) and Short-term support at 151.28, closing just beneath both of them. USB (NYSE:USB) made a Master Cycle low on Thursday as the Treasury finished its quarterly refinancing. USB is due for a period of strength over the next 2-3 weeks.The mid-Cycle resistance at 158.31appears to be the target, but it may go higher.
(ZeroHedge) One day after the ugliest 10Y auction in a long time, the US sold $15 billion in 30Y paper in what was yet another "deplorable" bond auction.
The refunding stopped with a sizable tail, with the high yield printing at 3.05%, 1.3bps wide of the 3.037% When Issued, with a light bid/cover, and small buyside takedown. Indirect bidders took down 59.1% of the auction today, and Direct bidders took down 5.3% of the auction.
The high yield of 3.05% was above last month's 2.938% in April but below the 3.17% in March. It also tailed the When issued at 1pm.
The euro bounces from Long-term support.
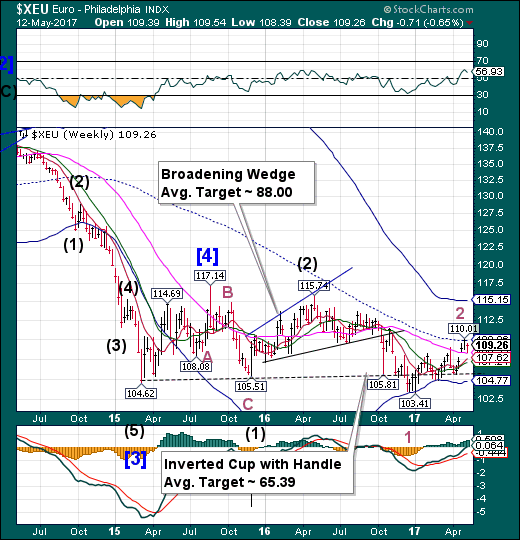
The eurodeclined to Long-term support at 108.33 where it bounced on Thursday. The suggested decline appears to be underway with a sell signal given at the cross of Long-term support. The Cycles Model suggests nearly a month of decline straight ahead in the euro.
(ArmstrongEconomics) Emmanuel Macron’s victory promises no change for Europe and it has been the blessing Brussels wanted so badly to further advance the federalization of Europe. Macron will surrender far more French sovereignty to Brussels than anyone suspects based upon reliable sources.
Macron is a technocrat and the youngest President in France ever at 39. His message of surrendering the sovereignty of France was the subtle use at his rally in Paris of the European anthem, Beethoven’s “Ode to Joy,” rather than the Marseillaise. This was indeed a powerful gesture of a surrender to Brussels that will be full and complete. It also signals there will be no change in direction or reform from Brussels.
EuroStoxx pulling back.
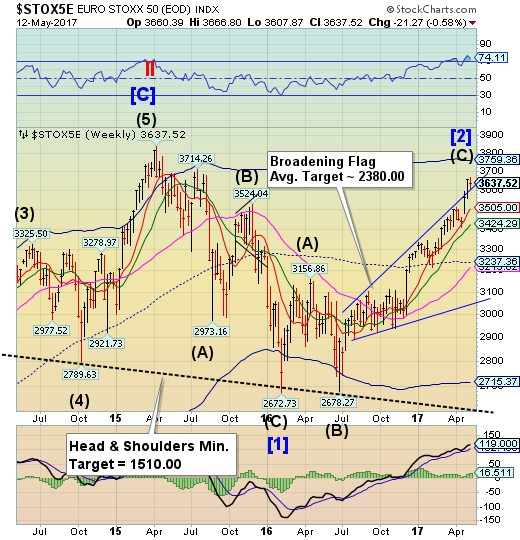
The Euro Stoxx 50 Index made a new high on Monday, then pulled back, testing the Broadening Flag trendline. The Monday high marked the 315th day from the Brexit low. EuroStoxx may now be due for a correction.
(CNBC) European equity funds have seen a total of $6.1 billion worth of inflows in the past week, marking the highest on record, according to data tracking firm EPFR.
This is the first time that flows into European equity funds have crossed the $6 billion mark since EPFR started tracking the data in 2000. Of the total $8.8 billion invested in global equities, EPFR data shows a total of $6.1 billion poured into European stock markets, $2.4 billion into U.S. equity markets and the remaining in other markets.
Analysts have attributed this investor optimism to Emmanuel Macron's win in the French presidential election. In a research note from Bank of America Merrill Lynch (NYSE:BAC), analysts argue that flows into European equities have rebounded but have plenty of room to recover.
The yen challenges mid-Cycle support.
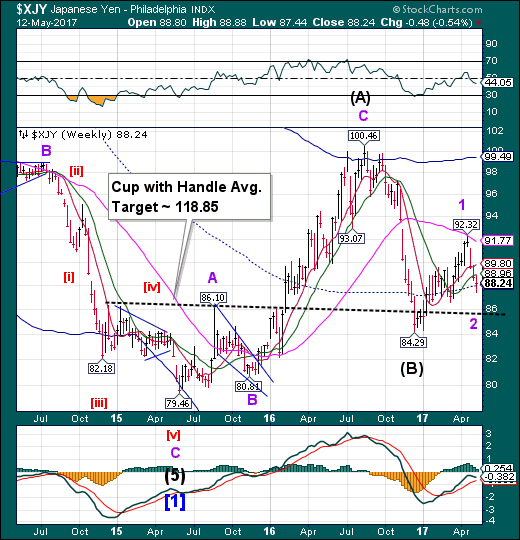
The yen declined even further than anticipated, challenging mid-Cycle support at 88.02 on Wednesday, then closing above it. The Cycles Model suggests thatCyclical strength may resume in the next week.
(SeekingAlpha) From March 10 through April 11, the Japanese yen was the strongest currency in the world. It appreciated 4.7% against the dollar. Among the majors, the sterling same in second place with a 2.7% gain. Among emerging market currencies, the yen edged past the Mexican peso's 4.4% rise.
That was then. This is now. Since April 11, the yen is the world's weakest currency. It lost 3.6% against the greenback. The Canadian dollar is a close second with a 3.3% decline. In the emerging market space, the Chilean peso has been the worst performer, nursing a 2.7% loss.
The reversal of the yen lines up well, with the sell-off in US Treasuries and the widening of the US interest rate premium over Japan. The US 10-year yield bottomed near 2.16% on April 18. The dollar bottomed against the yen the previous day just above JPY108. The US premium over Japan on 10-year paper bottomed on April 18 around 2.16%.
The Nikkei rallies toward 20000.
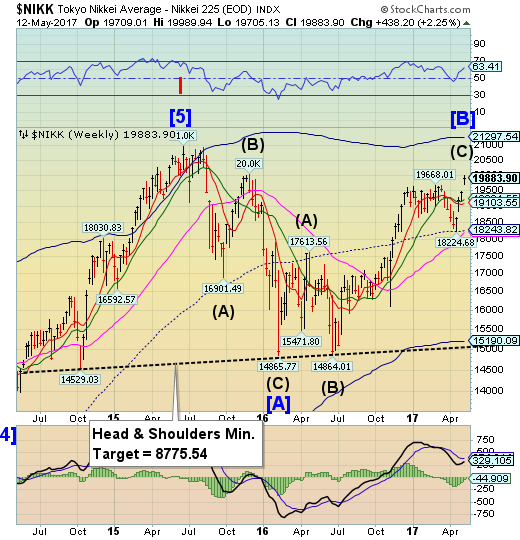
The Nikkei has continued its rally toward 20000.00 this week. Whether it breaks through that resistance or not will be telling. A decline beneath Short-term support at 19103.55 may put the Nikkei on a sell signal.
(Bloomberg) Nader Naeimi can’t ignore it any longer after Japanese stocks added more than $210 billion in value in less than a month, sending the Nikkei 225 Stock Average within touching distance of 20,000.
The head of a dynamic investment fund at AMP Capital Investors Ltd. has been pulling money from emerging markets to invest more in Tokyo shares. His logic is simple: the market is undervalued after lagging behind peers for much of 2017, the yen is set to fall, and the concerns that held the Nikkei 225 back earlier this year have receded.
U.S. dollar challenges Long-trem support
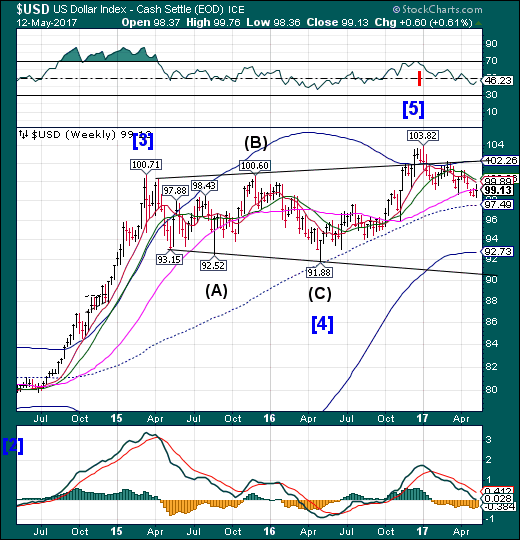
USD challenged Long-term resistance at 99.24 after making a Master Cycle low on Monday. However, it didn’t last. USD appears to be on a sell signal that may imply further declines ahead.
(Reuters) Net long positions on the U.S. dollar dropped in the latest week to their lowest since early October, according to calculations by Reuters and U.S. Commodity FuturesTrading Commission data released on Friday.
The value of the dollar's net long position fell to $11 billion in the week ended May 9, from $12.7 billion in the prior week. The euro saw its first net long positioning since early May 2014 in the latest week, of 22,399 net long contracts.
The drop in the dollar's net long position and the euro's move to a net long from a net short position came after centrist Emmanuel Macron, a 39-year-old independent who ran on an unashamedly pro-European platform, soundly defeated anti-EU candidate Marine Le Pen in the second round of France's presidential election on May 7.
Gold bounces near mid-Cycle support.
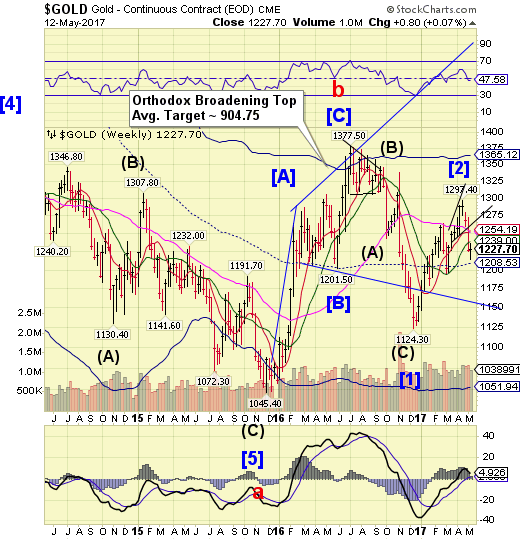
Gold bounced near mid-Cycle support on Tuesday, testing Intermediate-term resistance.It came about a week before its expected Master Cycle low, leaving some questions whether a deeper low may follow. There may be a lower test of mid-Cycle support in the coming week.
(Reuters) Gold rose on Friday andwas set to end the week little changed as the sudden sacking ofthe head of the FBI in the United States stoked investorconcerns and boosted demand for bullion, and the U.S. dollar andTreasury yields fell.
Spot gold was up 0.3 percent at $1,228.01 an ounce by2:52 p.m. EDT (1852 GMT), hovering around the 100-day movingaverage. Gold rose 0.5 percent in the previous session, its biggest one-day gain in a month.
Crude retests the neckline.
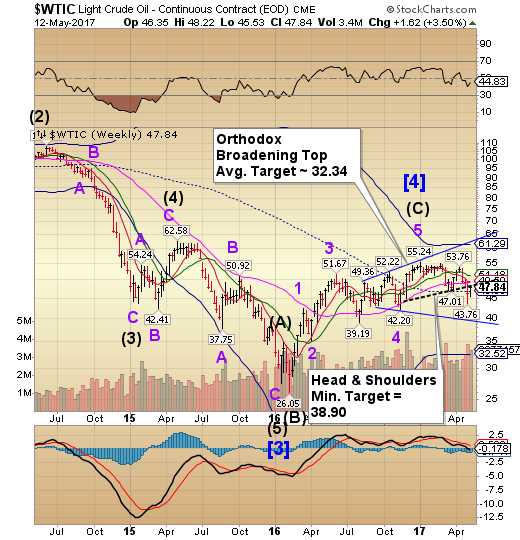
Crude retested the neckline of its Head & Shoulders formationthis week in preparation for a probable larger decline to follow. This action suggests the decline may not be finished. The Head & Shoulders formation indicates the probable next target.
(OilPrice) Late last week, crude oil prices took a nose dive. WTI (West Texas Intermediate, the benchmark crude rate for futures contracts in New York) declined 4.8 percent on Thursday, fueled by massive overnight (and overseas) sell-offs. That translated into a 7.7 percent dive for the week to date.
If there has ever been a better example of the tail wagging the dog, I haven’t seen it.
As you’ve seen me say before, swings in oil prices often have less to do with market dynamics and more to do with paper traders – people trading futures, options, and other hedges. Of course, what does happen in the actual market may be the initial prompt for how such derivatives are played.
Shanghai Index slips beneath Long-term support.
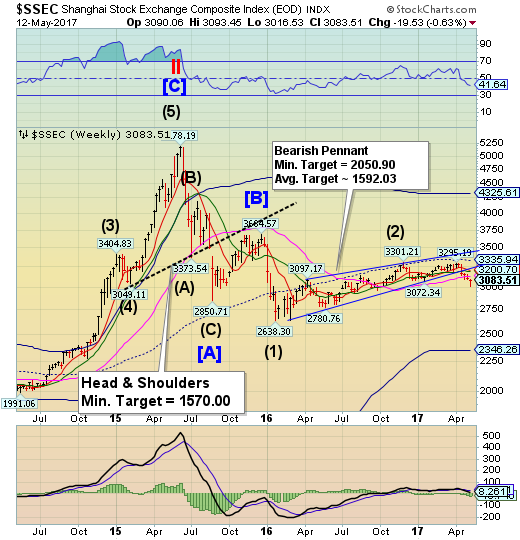
The Shanghai Index had a wild week after declining beneath Long-term support. The bounce came earlier than expected, so there may be some unfinished business on the downside yet. Attempts to limit the decline may not have the same effect they have had in the past.
With everyone, including Pimco, now acknowledging what we said most recently in February, namely that China's credit impulse is the main, if not only variable, that determines the fate of global reflation, the latest credit numbers released by the PBOC overnight very closely watched by macro traders around the globe in light of the ongoing liquidity discussions surrounding the deleveraging narrative.
What was most notable, however, was the "entrusted loans" category, (the broadest proxy for ‘shadow financing’) which confirmed China's recent crackdown on shadow banking, and posted the first contraction in a decade, going all the way back to 2007.
The Banking Index may be completing a right shoulder.
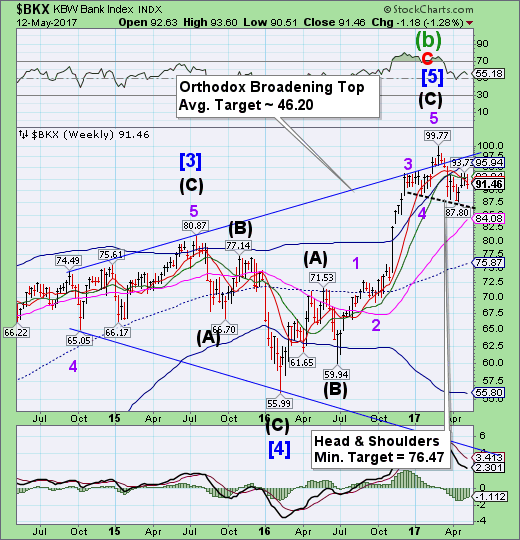
BKX retested Intermediate-term resistance at 92.84, but could not close above it. These signal remains in place with a probable new target near mid-Cycle support at 75.87.Serious investors may be well served to sell any rally rather than buy the dip, as the decline may resume imminently.
Commerce Secretary Wilbur Ross told CNBC on Friday the new U.S. trade deals with China include a promise to allow Chinese banks greater access in America.
In addition to paving the way for U.S. beef imports to China and Chinese chicken imports to the United States, Ross said the agreements with Beijing lay the groundwork for treating Chinese banks the same way as the U.S. treats other foreign banks.
Ross said on Squawk Box:
We've agreed to treat their financial institutions, their banks, the same way as we evaluate other foreign banks when they want to come and open up activities in the U.S ... Clearly China, whose banks are among the largest in the whole world, wants access to the U.S. banking market.
(MishTalk) On occasion, I get emails from a commercial banker friend who lives in California. Today he provides anecdotes from a business banker’s perspective. Hey Mish
It’s been a while since my last email. Here are some views from this business banker’s chair.
I had lunch with a financial planner today, and he said the new tax plan coming from DC would eliminate tax-deductibility of state taxes. While Federal tax rates might go down a little, the net impact would be higher total taxes via higher total federal taxes due to the loss of writing off state taxes. At least, that is the view for those of us in high state income tax states like CA. He already had clients exiting the state.
The gentleman I had lunch with today is a lifelong financial planner, mostly on the insurance side. He stated that the insurance industry today is in worse shape than that of the banking industry during the prior recession, and yet we hear very little about it. If so, we both agreed that the world isn’t ready for an insurance industry meltdown anything like that of the Banking industry during the last recession.
When we first said three weeks ago that the spectacular, sudden implosion of Canada's largest alt-lender Home Capital Group or HCG - whose fate we had followed closely since 2015 - was Canada's own "New Century Moment", the parallels were more than just the obvious: like in the US, it took the market nearly a year to realize the full implications of the subprime collapse which first manifested in the failure of New Century and its subprime lender peers. When all was said and done, the world's central banks had to pump (and still do) trillions into the financial system to stop it from disintegrating.
Slowly but surely, Canada is starting to appreciate just how serious the Home Capital failure is, and how the unprecedented bank run that has led to 94% of retail deposits fleeing the troubled lender.
In the aftermath of the global WannaCry ransomware attack, which has spread around the globe like wildfire, a significant number of corporations and public services have found their infrastructure grinding to a halt, unable to operate with unprotected if mission-critical computers taken offline indefinitely.
One place which seemed to have emerged relatively unscathed from the global cyber-havoc (aside from the US, which is ironic as it is the U.S. NSA that was created the hacking software) has been China. Or so it seemed due to lack of media reports from the mainland. Now, courtesy of 95cn.org, and its twitter account, we have the first visual evidence that China too was materially impacted, to the point where not only local ATMs had been taken offline, but Chinese traffic police, immigration authorities and various public security bureaus and schools have suspended normal work until the malware threat is resolved.
