VIX made a Master Cycle low on Wednesday, March 15, then closed the week above Short-term support/resistance at 11.20. An aggressive buy signal may be forthcoming should the VIX rally back above its Intermediate-term resistance at 11.72. The breakout above its consolidation area may produce a slingshot move.
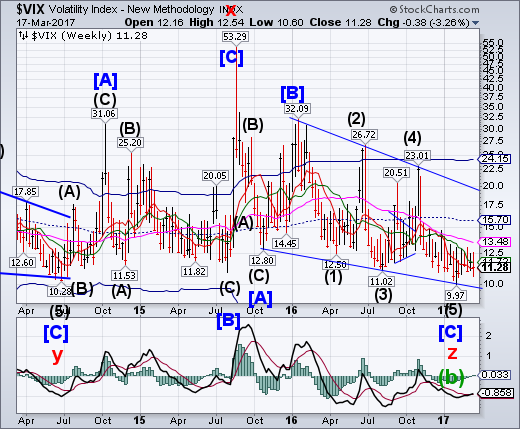
(Bloomberg) Everything’s fine and calm on Wall Street if you trust the market’s standard fear gauge. Just one problem: the world doesn’t feel so calm these days.
Between an unpredictable political climate, rising interest rates and stretched valuations, there’s building frustration that the CBOE Volatility Index, or VIX, is losing its luster as a reflection of investor anxiety. The measure, which tracks expected volatility through options pricing, sits just two points above its historical low.
SPX ekes out a small gain
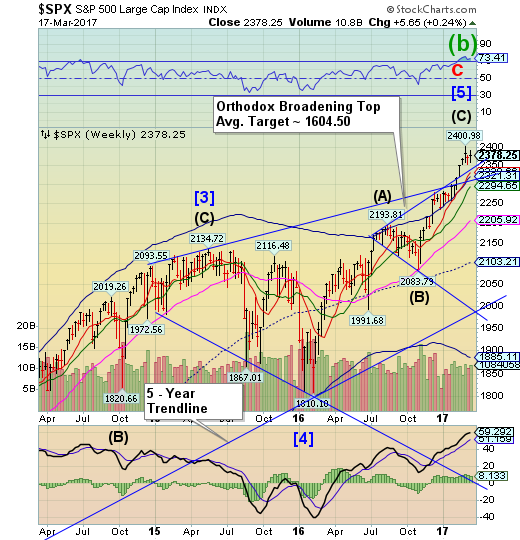
SPX had a loss for the week after six straight weeks of gains. A decline beneath its weekly low at 23574.54 and Short-term support, both near 2320.54, gives the SPX an aggressive sell signal. A break of those supports may send the SPX to its cycle Bottom at 1888.33, or possibly lower.
(ZeroHedge) The highly compensated world of active fund managers continued to disintegrate before their eyes in the last week, when according to EPFR data even as overall cash continued to flood into equities for a total of $14.5 billion, the 11th consecutive week of inflows, this was entirely due to allocations to ETFs, which saw $19.7 billion in inflows, the highest weekly amount YTD, offset by $5.1 billion in outflows from actively managed funds.
NDX makes another new high
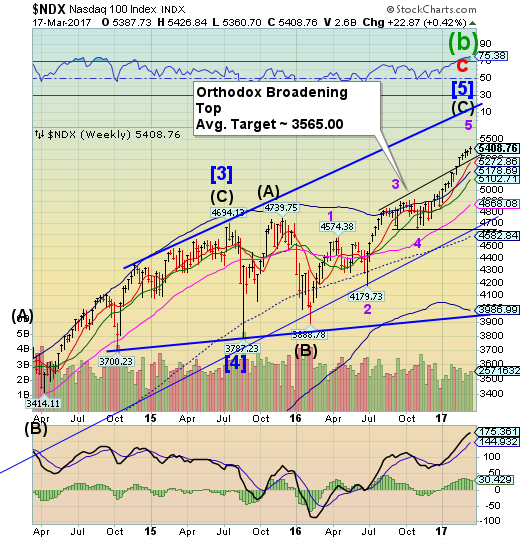
NDX made another new high on Wednesday.NDX is still extended, so a breakdown may not register until it declines beneath Short-term support at 5272.86.
(ZeroHedge) While quad-witching on index-rebal day usually leads to odd sights in the market, there was little confusion about what happened at the open, when as Bloomberg first noted, Apple shares (NASDAQ:AAPL) dipped 0.1% lower after a size seller dumped 9.24 million AAPL shares in a single block trade at the NASDAQ open, at a price of $141.00, amounting to just over $1.3 billion worth of AAPL stock.
High Yield Bond Index bounces from Short-term support.
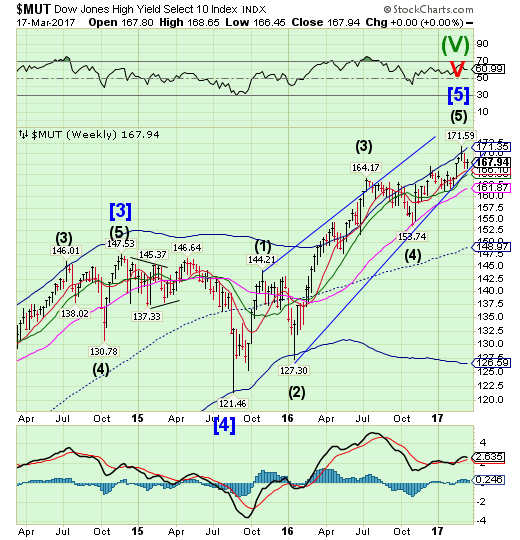
The High Yield Bond Index bounced from Short-term support at 166.10, completing a 42.5% retracement of its decline. A break beneath the Diagonal trendline and Short-term support at 166.10 implies a complete retracement of the rally may occur. The Cycles Model suggests weakness ahead.
Financial Times has a story entitled, “Junk bond funds see biggest outflows since late 2014”.
Is USB completing its decline?
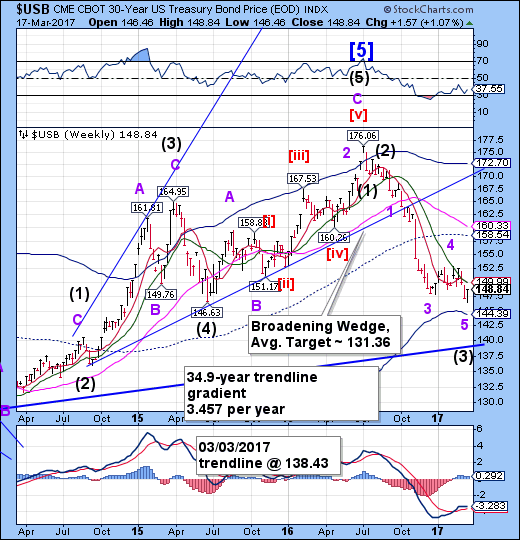
The Long Bond declined to a new Trading Cycle low. The Cycles Modelnow suggests that a period of strength may develop for up to two weeks. The mid-Cycle resistance at 158.54 still appears to be the target.
(CNBC) Since the U.S. elections in November, 10-year Treasury yields have risen markedly, as, of course, has the S&P 500. The current steepness of the yield curve – in other words, the difference in yield between bonds with shorter and longer maturities – is creating an opportunity in the Treasury market. On a six-month view, we believe that 10-Year Treasurys, which yield more than their shorter-dated equivalents, now look like an attractive home for money relative to cash.
The euro rises above Intermediate-term resistance.
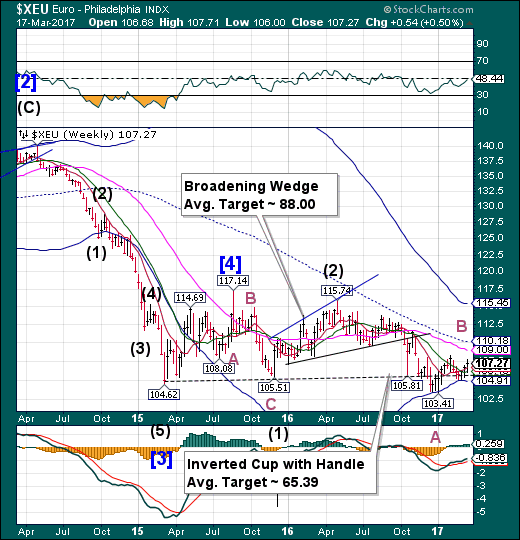
The euro appears to be finishing an irregular correction. The period of strength is running out and it appears that up to three weeks of decline may be ahead.
The euro fell back against the dollar on Friday after a poll showed far-right anti-EU leader Marine Le Pen extending her lead over centrist Emmanuel Macron in the first round of France's presidential elections.
The Opinion way poll also showed Le Pen, who has pledged to take France out of the euro, narrowing Macron's lead in the second round run-off.
The euro traded broadly flat in morning European trade after two days of gains against the dollar before slipping to a day's low of $1.0732, down 0.3 percent, after the poll was published.
Euro Stoxx may have completed is rally.
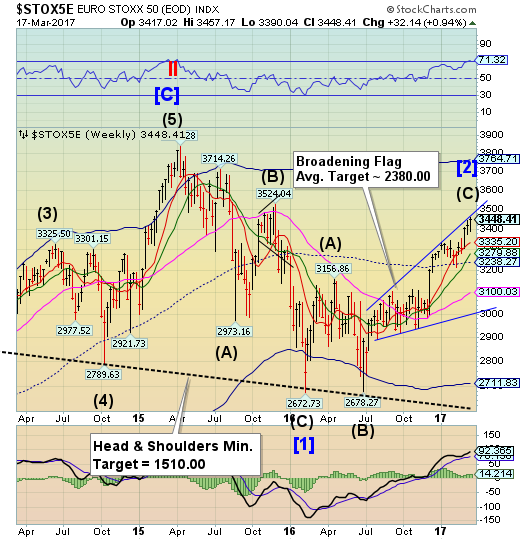
The Euro Stoxx 50 Index rallied to the Broadening flag trendline again, easing back to the close. The period of strength may be coming to a hard stop. A break of short-term support at 3335.20 may offer a sell signal which may be confirmed beneath Intermediate-term support at 3279.88.
European stocks advanced to the highest level since December 2015, posting a weekly advance that was supported by the Federal Reserve raising interest rates and investor relief over the result of Dutch elections.
The Stoxx Europe 600 rose than 0.2 percent at the close in London, pushing the five-day gain to 1.4 percent. Mining stocks posted their best weekly performance since November, climbing 8.4 percent.
Barclays) analysts including Lars Brorson wrote in a note:
The green shoots in mining capex are starting to emerge after a four-year downturn ... Miners are generating strong cash flows, deleveraging balance sheets rapidly and -- as is now clear from 2017 budgets -- stepping up capital spending again.
The yen rises above its consolidation zone.
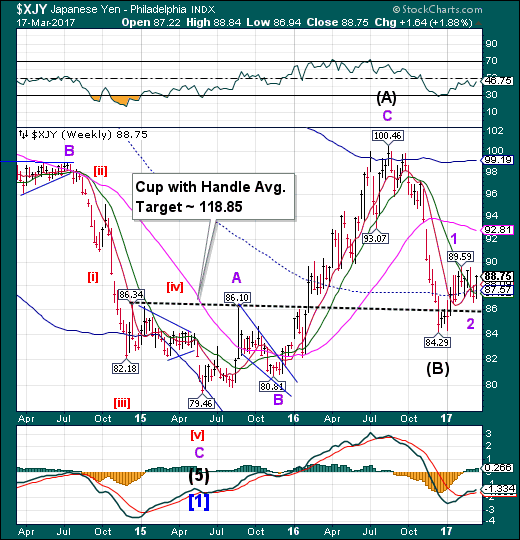
The yen rallied out of its consolidation zone to begin its thrust toward its Cup with handle target. This action may be considered a strong buy signal, with a breakout above the congestion zone confirming it. The Cycles Model suggests a period of strength lasting at least another week before corrective activity sets in.
Much has been written about the yen's safe haven status. A quick look at the charts shows that, during the great recession, USD/JPY went from almost 124, down to about 75.60.
The Nikkei has an inside week.
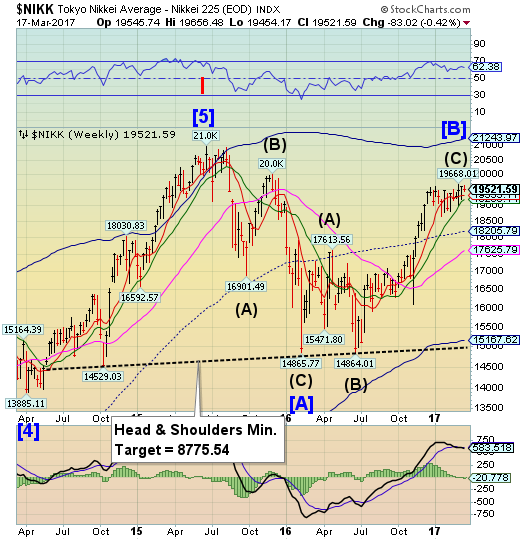
The Nikkei consolidated at a higher level, just above Short-term support a t019335.11, but could not make a new high. A breakdown beneath this consolidation zone and Intermediate-term support at 19206.14 confirms a sell signal. A loss of the next supports suggests a potential decline to the Cycle Bottom at 15167.62 or lower.
The Nikkei 225 index was unable to make any headway on Friday with a subdued dollar and U.S. profit taking curbing support as uncertainty surrounding G20 meetings were also a significant factor.
U.S. equity markets were hit by profit taking following strong gains after the Wednesday’s Federal Reserve statement with the S&P 500 index declining 0.16% on the day.
Energy prices were little changed on the day which did not provide a clear lead for the Japanese market. Asian equities were mixed on the day with a decline of just over 1.0% in the Shanghai index on concerns surrounding higher money-market rates having a negative impact on Japanese stocks.
U.S. dollar break down
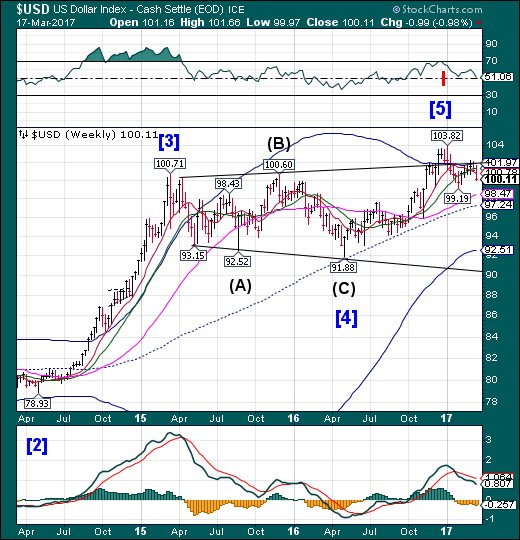
USD broke down from the upper trendline of its Broadening Top near 102.00, declining beneath Intermediate-term support at 101.30 and confirming last week’s sell signal. The Cycles Model suggests a significant low is now due. However, the low may extend for up to a week.
(Reuters) Speculators bolstered bullish bets on the U.S. dollar, pushing net longs to their highest since late January, according to Commodity Futures Trading Commission data released on Friday and calculations by Reuters.
The value of the dollar's net long position totaled $17.59 billion in the week ended March 14, up from $15.26 billion the previous week. Net long positions on the dollar rose for a third straight week.
Net long dollar positioning grew on the expectation of an interest rate hike in March, which was not the case a few weeks ago. At the beginning of the year, the market had priced in a rate increase in June at the earliest.
Gold retraces prior weeks loss
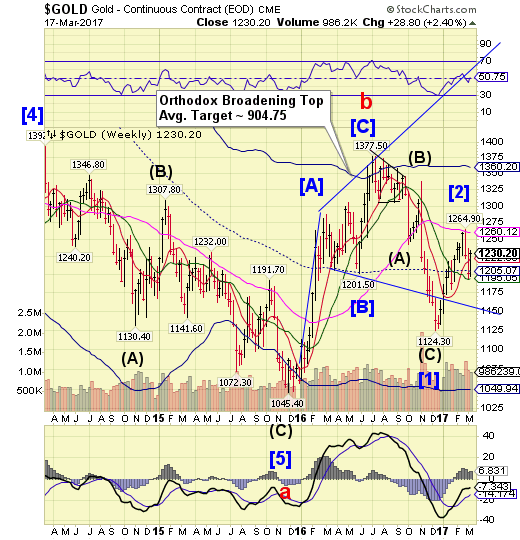
Gold continued declining this week, making a possible Trading Cycle low on Friday. Both the Cycles Model and Orthodox Broadening Top pattern anticipate a continued decline with only short-term bounces until it reaches its target illustrated on the chart.
(CNBC) Gold logged its ninth straight losing session on Friday, for the metal's longest string of declines since July 2015. And some say the drop spells opportunity.
"We think right now could be a good entry point for gold," RBC Capital Markets commodity strategist Christopher Louney said Friday on CNBC's "Power Lunch."
In prior months, Louney has staked a bearish view on the metal, arguing that gold had been driven higher by investor demand which would eventually dry up. This call has proved prescient; after peaking above $1,335 in July 2016, the metal briefly fell below $1,200 in Friday trading.
Crude broke down from its consolidation.
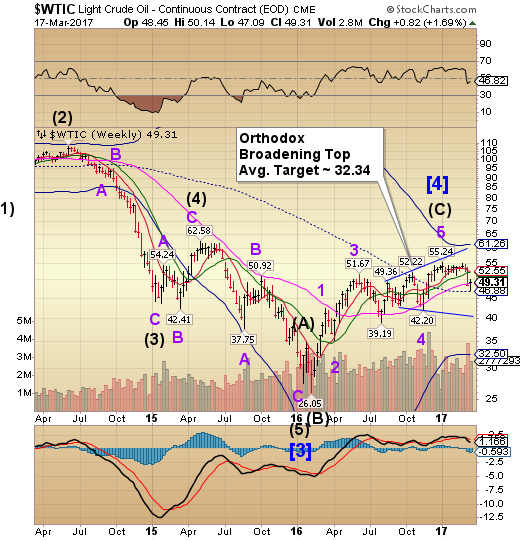
After breaking beneath its short-term support at 53.50 last week, crude fell hard to close beneath Long-term support at 48.87. Crude is now on a sell signal. The Cycles Model suggests a significant low may occur in the next two weeks.
Oil prices plunged on Wednesday and Thursday, dropping to their lowest levels since December when the optimism surrounding the OPEC deal was just getting underway. WTI dipped below $50 for the first time in 2017 on March 9, a two-day loss of more than 8 percent.
The catalyst for the sudden decline in prices was yet another remarkably bearish report from the EIA, which showed an uptick in crude oil inventories by 8.2 million barrels last week. That takes crude stocks to another record high, and it was the ninth consecutive week of inventory builds.
Shanghai Index hovers above support.
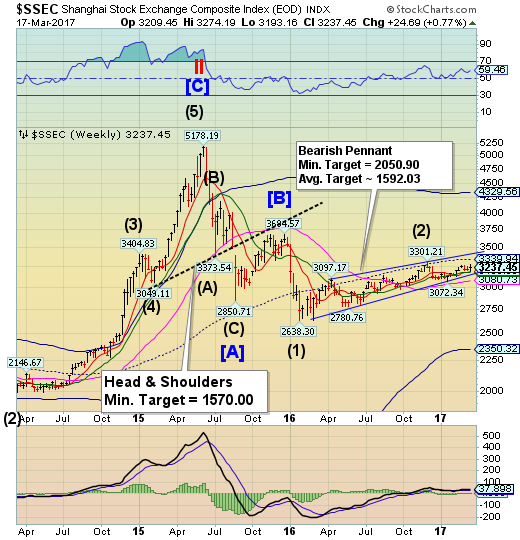
The Shanghai Index appears to be hovering above multiple supports at 3179.00 without making a new high or low.The fractal Model suggests the Shanghai is due for another 1,000 point drop. The index restores its sell signal beneath Intermediate-term support and trendline at 3164.50.
It's a well-known risk, perhaps the biggest to the global financial system: China's debt is too high, with estimates ranging from 250% to 300% of GDP per the IIF:
And while China has largely ignored, or avoided, discussing the troubling implications of its unprecedented debt load, this changed today when the head of China's central bank, Zhou Xiachuan finally admitted that it has a debt "problem" saying that corporate debt levels are too high and that "it will take time to bring them down to more manageable levels", underlining what has become the defining battle to put the world's second-largest economy on a more sustainable footing: keeping GDP growing at 6.5% (or above) while injecting trillions in new debt.
"Non-financial corporate leverage is too high," PBOC Governor Zhou Xiaochuan told reporters at a news conference on the sidelines of the annual parliament session.
The Banking Index pull back to the trendline.
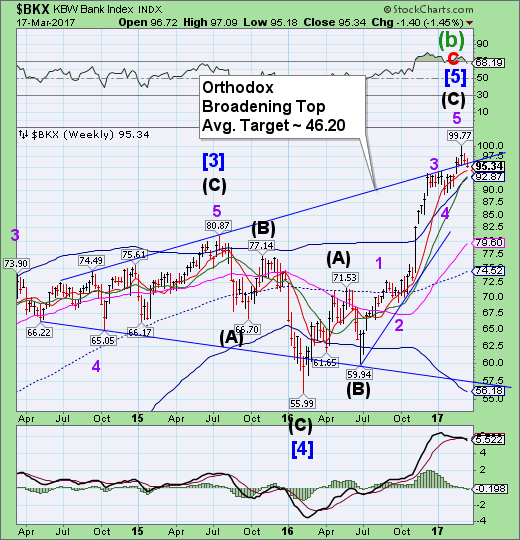
BKX challenged its Orthodox Broadening Top trendline at 96.50, where it consolidated. The The rally from the June 27 low appears complete. BKX appears to be ready for a large decline that may extend through the next week or longer, according to the Cycles Model.
President Donald Trump assured a group of U.S. community bank executives he’ll deliver regulatory changes that will make it easier for them to lend money.
Trump said on Thursday, during the meeting at the White House:
We must ensure access to capital ... You’ll be able to loan, you’ll be able to be safe, but you’ll be able to provide the jobs that we want and all create great businesses.
Trump was seeking the bankers’ input on which regulations may be crimping their ability to lend to consumers and small businesses, according to a White House statement. Trump previously called the 2010 Dodd-Frank financial regulatory law a “disaster” for small lenders and pledged to “do a big number” on it.
Russia's largest bank, Sberbank, has confirmed that it hired the consultancy of Tony Podesta, the elder brother of John Podesta who chaired Hillary Clinton's presidential campaign, for lobbying its interests in the United States and proactively seeking the removal of various Obama-era sanctions, the press service of the Russian institution told TASS on Thursday.
Sberbank said:
The New York office of Sberbank CIB indeed hired Podesta Group. Engagement of external consultants is part of standard business practices for us.
The basic laws of physics have seemingly ceased to exist in Australia, water is no longer wet, the sky is no longer blue and home prices are not in a "speculative bubble," at least according to some conflicted commercial banking executives who are massively long Australian housing.
Testifying before a parliamentary committee, the chief executives of National Australia Bank, Westpac Banking and Commonwealth Bank of Australia all said that while they are worried about elements of the housing market, prices aren’t over-inflated.
That's not what the bankers want to hear.
- *TRUMP STILL COMMITTED TO RESTORING GLASS-STEAGALL: SPICER
Interestingly this comment comes after President Trump met with a group of community bankers.
