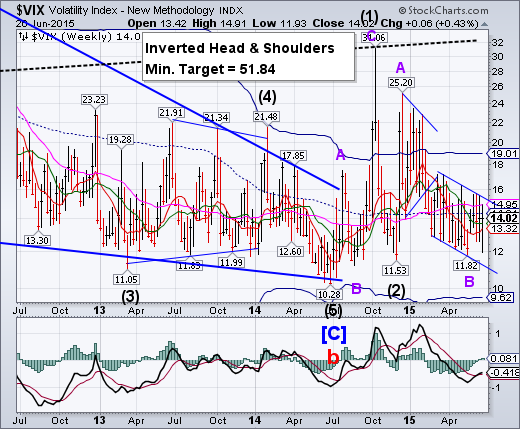
— VIX closed above Intermediate-term support at 13.68, maintaining the aggressive sell signal for SPX. A breakout above its descending trendline and prior high at 15.74 will announce the resumption of the rally in VIX and confirm the sell signal in the SPX.
SPX closes beneath Short-term support.
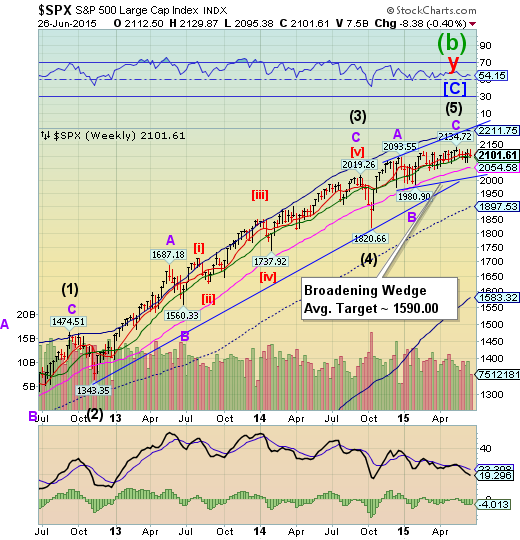
SPX closed beneath weekly Short-term support at 2108.79, but hasn’t yet closed beneath Intermediate-term support at 2096.52.This leaves SPX on an aggressive sell signal and vulnerable to a drop to or below the next (Long-term) support level at 2052.29 and the double trendlines near 2025.00 (also round number support at 2000.00).
(ZeroHedge) In a somewhat stunning reality check for the new normal, companies in the S&P 500 have started paying out more money to shareholders than they produce in operating earnings. The last time spending on buybacks-plus-dividends exceeded operating profit was Q2 2007... that did not end well...
S&P 500 companies spent $144.1 billion on share repurchases and paid out $93.6 billion of dividends. The total equaled 104.1 percent of profit, up from 95.1 percent in last year’s fourth quarter.
NDX closes beneath the Ending Diagonal trendline.
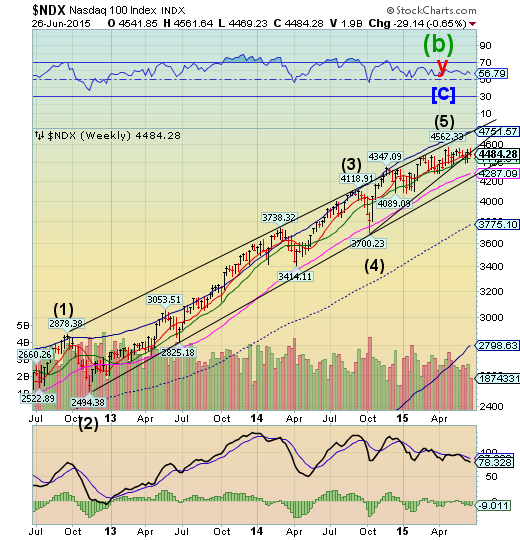
NDX closed beneath its Ending Diagonal trendline at 4500.00 this week. The loss of the trendline puts NDX on a sell signal.This implies a complete retracement to its October 15th low at 3700.23.
(CNBC) U.S. stocks closed mixed on Friday, posting a loss for the week, as investors digested earnings reports and awaited resolution on the Greece debt talks.
"I think overall in spite of Nike's (NYSE:NKE) good earnings... the stock market, especially the large caps, are just not ready to break out here," said Marc Chaikin, CEO of Chaikin Analytics.
The Dow Jones industrial average closed 56.66 points higher after briefly gaining more than 100 points. Leading blue chips, Nike ended more than 4 percent higher at a record following a strong earnings report.
In contrast to the blue-chip gains, the Nasdaq Composite dipped 1 percent as tech stocks declined. Micron (NASDAQ:MU) plunged 18 percent to below its 52-week low on a weak earnings report. The iShares Nasdaq Biotechnology ETF (NASDAQ:IBB) closed about 0.80 percent lower. Information technology fell about 1 percent to weigh on the S&P 500.
High Yield Bonds close beneath all nearby support.
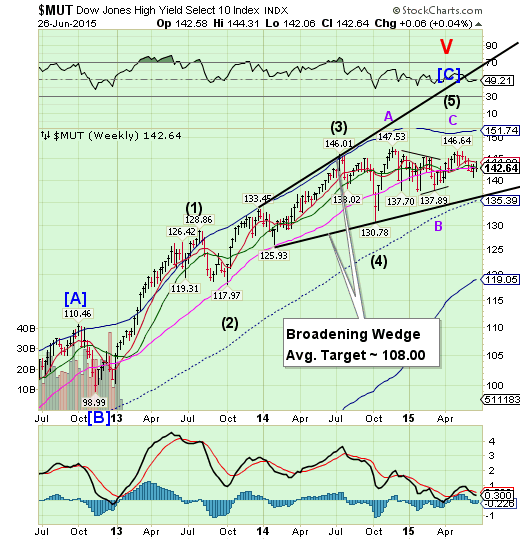
The High Yield Index remains beneath all Model supports, despite an attempt at overcoming them this week. It appears destined for the lower trendline of its Broadening Wedge formation. It is also due for a major low by early July. The financing of stock buybacks is being seriously threatened.
(WSJ) Carl Icahn is sounding the alarm about the state of the market.
In his latest string of tweets, billionaire activist investor Mr. Icahn calls the market “extremely overheated – especially high yield bonds.”
This isn’t the first time the legendary investor has expressed misgivings about valuations. Just last week, Mr. Icahn said he believes markets are “sailing in dangerous unchartered waters.” Almost a year ago, at CNBC’s Delivering Alpha conference, he said he was “very nervous about the market” and said people should “worry about the excessive printing of money.”
The euro closed above Short-term support.
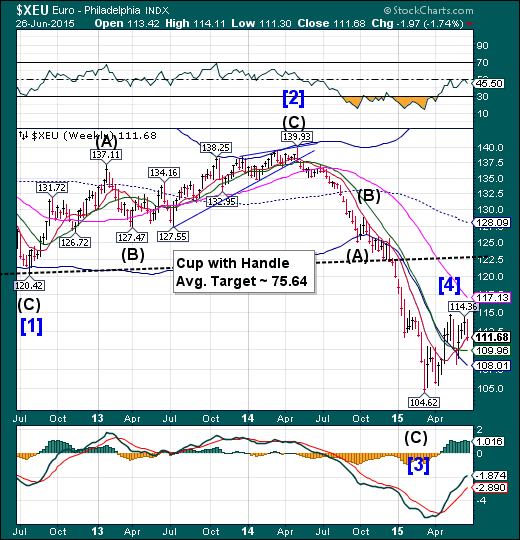
The euro closed only ticks above weekly Short-term support at 111.63 this week. Should it decline beneath this support, it may verify that it may be entering a period of weakness lasting for at least the next two weeks.
(ZeroHedge) In the aftermath of yesterday's "nuclear option" announcement by Greece, when in a dramatic after-midnight speech, Greek PM Tsipras announced that Greece would hold a referendum next Sunday, the day after the US independence day, the same Greek government made it very clear how it wants the Greeks to vote.
First, it was the Greek Energy Minister Panagiotis Lafazanis, head of the Left Platform movement of Syriza, who said in comments broadcast on state-run ERT TV that a no vote by the Greek people in July 5 referendum “will open the road for a new future for the country" adding that the dilemma facing Greeks is “whether to live better or not. Greek people are aware of difficulties of a new starting point, they’re ready to support new national effort."
Then the alternate health and social security minister Dimitris Stratoulis doubled down, telling ERT-TV that Greeks are being given the opportunity to decide the way forward and “I’m optimistic” that they will give a “resounding” no to the “provocative” demands of the country’s creditors. The only issue is the question being put to the people in the referendum." It got better when he said that "Greeks are being asked to vote whether the country should be a colony, or not, of creditors."
Euro Stoxx challenges resistance.
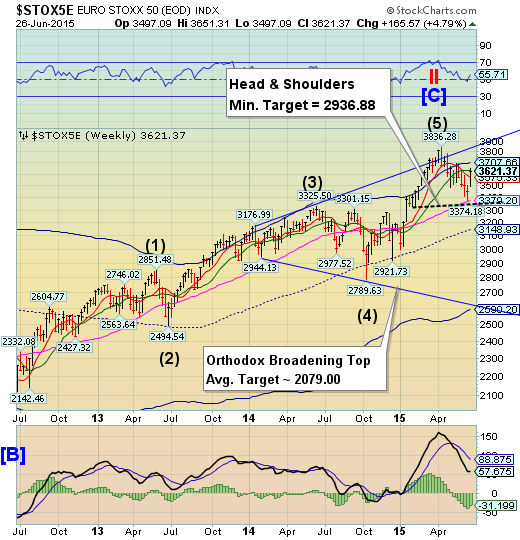
EuroStoxx 50 challenged its Intermediate-term resistance at 3633.94 this week, closing beneath it. It continues on a sell signal, despite the heightened volatility that may last through early September. A panic decline may ensue as STOXX declines beneath Long-term support at 3379.20, and a new Head and Shoulders neckline just beneath it.
(WSJ) European stocks edged higher Friday, supported by investor optimism that Greece and its international creditors will clinch a debt deal.
Having slipped earlier in the day, the Stoxx Europe 600 closed 0.1% higher to bring its gains for the week to just below 3%. Athens main stock index rose 2.0%. Earlier Friday, it was down more than 1.5%.
The yen retreats from Short-term resistance.
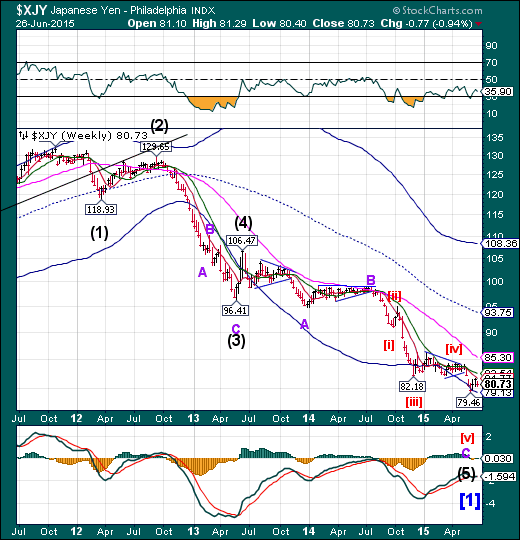
The yen retreated from Short-term resistance at 81.77 this week, making a 50% retracement of its recent gains. A breakthrough at resistance may reveal a period of strength that may last a week or longer.
(Reuters) The euro fell against the safe haven Swiss franc and yen on Friday, as investors cut exposure to the single currency before the weekend amid worries over whether Greece and its creditors can avert a debt default.
Some traders expect further risk reduction on Friday, a factor likely to underpin both the franc and the yen. Still, many investors and fund managers held out hopes that a last-minute deal could be stitched to keep Greece in the eurozone.
Greece failed again on Thursday to clinch a deal with its international creditors, setting up a last-ditch effort on Saturday to avert a default next week.
The Nikkei makes its last hurrah?
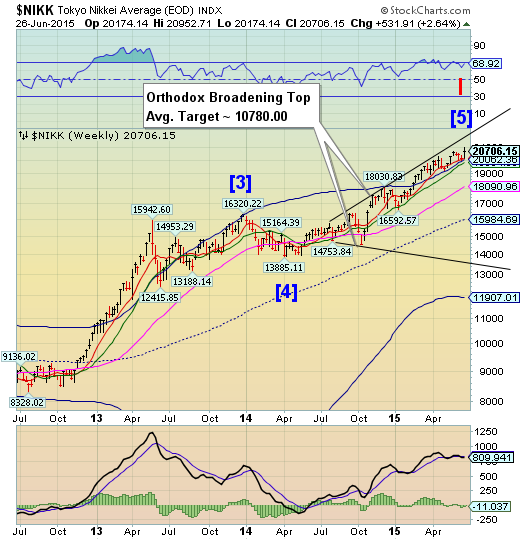
On Tuesday, the Nikkei made its highest point since its peak in June, 1996, 19 years ago. This may be indicative that a new bull market may have started in Japan. But first, a 50% retracement may be in order.
(Reuters) The Nikkei share average slipped on Friday, as investors opted for caution while waiting to see whether Greece can clinch a deal over weekend to avert a default, but Japan's benchmark index still posted its first weekly gain in four weeks.
The Nikkei fell 0.3 percent to 20,706.15, though it was up 2.6 percent on the week.
The Nikkei volatility index rose to 18.5 percent from a 10-month low of 16.4 percent hit earlier in the week, reflecting nervousness over Greece, though the level of volatility is still very low by historical standard.
The broader Topix dropped 0.2 percent to 1,667.03, while the JPX-Nikkei Index 400 shed 0.3 percent to 15,032.58.
U.S. dollar rose above Short-term support/resistance
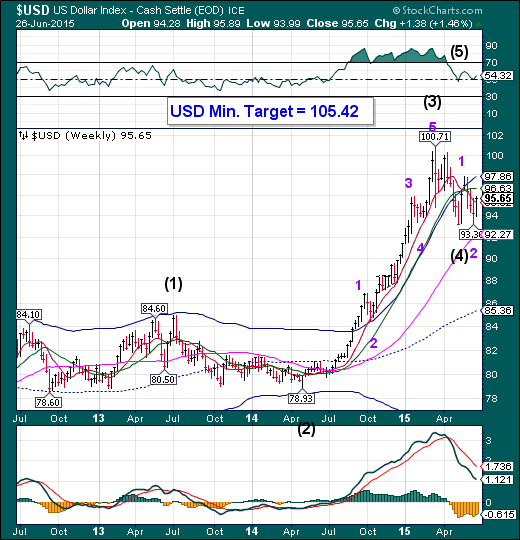
The US dollar rose above weekly Short-term support at 95.32. This gives credence to the observation that the decline may be ended and next probe higher is likely to break out above its Cycle Top resistance at 97.86. The Cycles are now positive through mid-July.
(Reuters) Speculators increased bullish bets on the U.S. dollar in the latest week, according to Reuters calculations and data from the Commodity Futures Trading Commission released on Friday.
The value of the dollar's net long position rose to $26.07 billion in the week ended June 23rd, from $23.82 billion in the previous week. It was the second straight week net dollar longs came in under $30 billion.
Net dollar longs in the previous week had fallen to their lowest in 11 months.
USB fails at Long-term support/resistance.
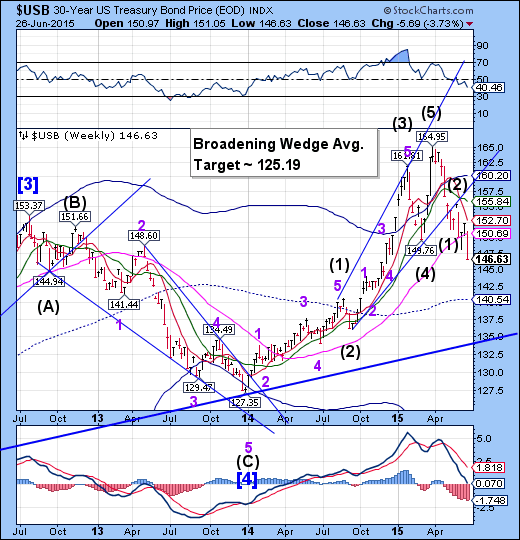
The Long Bond failed at weekly Long-term support at 150.69, changing the outlook in the Long Bond to bearish. The next significant low may not arrive until early September, if my reading of the Cycles Model is correct.
(WSJ) U.S. Treasury bonds sold off on Friday, capping a week that sent the yield on the benchmark 10-year Treasury note to the highest closing level in nearly nine months.
Optimism that Greece would reach a deal with international creditors this weekend to avoid a potential default sapped demand for haven bonds. Fresh signs of the U.S. economy gaining traction raised concerns that the Federal Reserve may start increasing interest rates as soon as this coming September.
Gold falls from Long-term resistance.
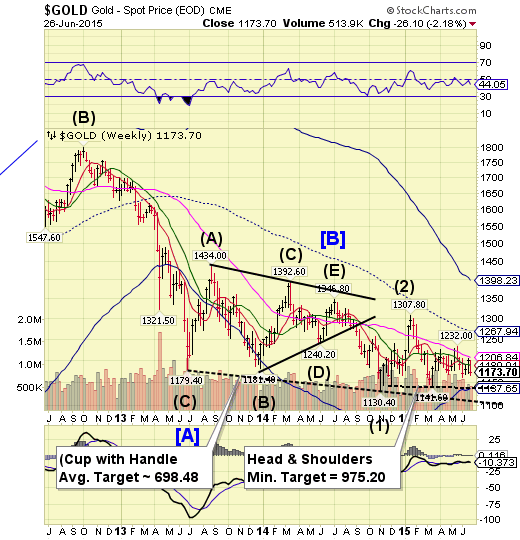
The latest rally attempt in Gold was capped at weekly Long-term resistance at 1206.84 and closed beneath weekly Intermediate-term support at 1188.83. A probable decline beneath 1141.60 may develop, which may trigger the Head and Shoulders formation with a minimum target of 975.20. The Cycles Model now suggests a substantial low in late July.
(Reuters) - Gold was little changed on Friday, after falling to a three-week low, on short-covering at the end of the week and caution ahead of crunch talks on Greece this weekend, while concerns over the longer-term outlook for the metal provided price pressure.
Greece failed again to clinch a deal with its international creditors on Thursday, setting up a last-ditch effort on Saturday, either to avert a default next week or start preparing to protect the eurozone from financial market turmoil.
Spot gold was down 0.1 percent at $1,171.55 an ounce at 1407 GMT, after falling to $1,168.25, its lowest since June 5th. It was on track to close the week down 2.2 percent.
The crude rally may have run out of time.
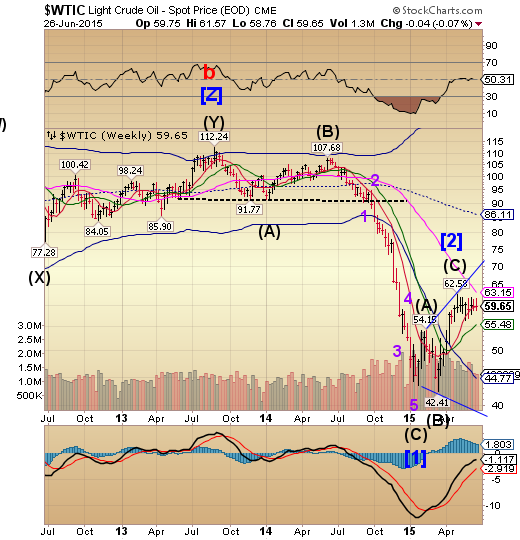
Crude closed beneath its weekly Short-term resistance at 59.67. It is now time to be prepared for a massive decline into mid-July.
(Bloomberg) Crude oil ended below $60 a barrel, as near-record U.S. production prolonged an oversupply amid the lowest trading volatility in eight months.
U.S. crude stockpiles remain 84 million barrels above the five-year average for this time of the year. The nation pumped near the fastest pace in more than three decades, even as the rig count dropped. A measure of future price fluctuations slipped to the lowest level since October.
Oil’s rebound from a six-year low has faltered on signs a global glut will persist as rising prices spur output. The Organization of Petroleum Exporting Countries has pumped more than its quota of 30 million barrels a day for the past 12 months, as the group seeks to defend market share against higher-cost producers.
Shanghai Index crashes a second week.
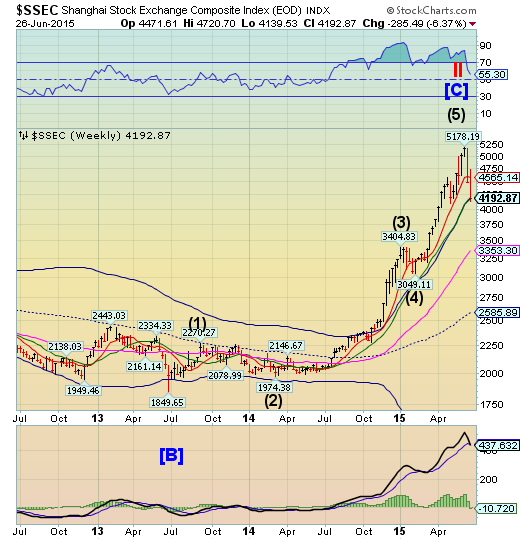
The Shanghai Index challenged bear market territory (-20%) this week as it closed beneath Intermediate-term support at 4208.82. It appears that the current weakness may extend through early-to-mid-July. The Cycle Top is at 4179.57, so a further decline may challenge weekly Long-term support at 3353.30.
(ZeroHedge) On May 10th, China cut its benchmark lending rate for the third time since November. The move came just a few days after several brokerages tightened margin requirements, which triggered a 4% decline in Chinese stocks.
At the time, we noted that the PBoC had done something similar not even a month prior, when in April, the central bank slashed the RRR rate for the second time in 2015, after a decision by the CSRC to crackdown on brokerages’ use of umbrella trusts to skirt margin limits caused futures to crash.
Here’s what we said after each of those policy rate cuts: “We wonder then, if Beijing is taking its cues from stocks or from the economy.”
The Banking Index may have made its final high.
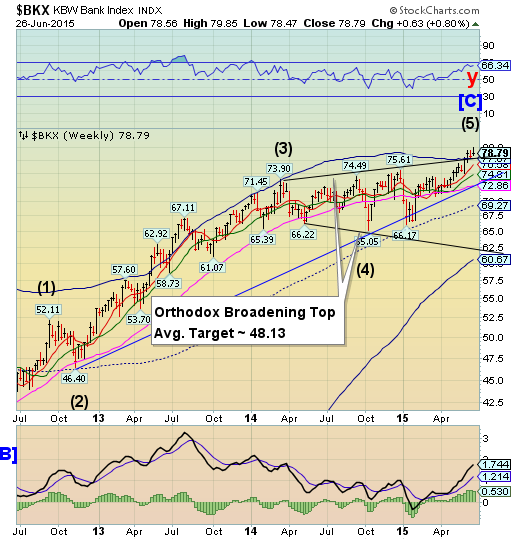
--BKX appears to have made its final high on Monday, giving up most of its weekly gains through the rest of the week. The BKX must decline beneath its upper trendline and Cycle Top support at 77.87 to produce a reversal. The Cycles Model now implies that BKX may decline through the first week of July.
(ZeroHedge) Following Tsipras' surprise referendum decision (and subsequent pulling of proposals by Troika the institutions), Greece's bank jog has turned into a full sprint. ATM lines began to form at 2am, minutes after the announcement and now many ATMs are out of money and, as Bloomberg reports, some Greek banks are drastically limiting cash transactions. Despite all the reassurances that "banks will open Monday," two senior bank executives have warned that some lenders will not be able to open Monday (unless more emergency liquidity is released).
Many ATMs have been drained...
(ZeroHedge) Because correlation does not equal causation, we present the following with no comment other than to note that according to Goldman's estimates (shown below), Alpha Bank, which has announced that web banking will "operate with limited functionality" over the weekend, happens to have the smallest ELA buffer of the four major Greek banks.
And of course, Greek PM Alexis Tsipras has just called for a referendum on euro membership to be held next Sunday.
Draw your own conclusions.
(BusinessInsider) Earnings season is right around the corner for most of Wall Street.
For many Wall Street firms, 2015 became the first year in a long time that big banks finally started to outpace global market indices.
But that could change in a heartbeat, and there is reason to believe that it will.
Earlier this month, US banks didn’t get the good news that would have been a short-term boost. If the Federal Reserve opted to increase the interest rate, banks’ lending businesses would inevitably become more profitable.
