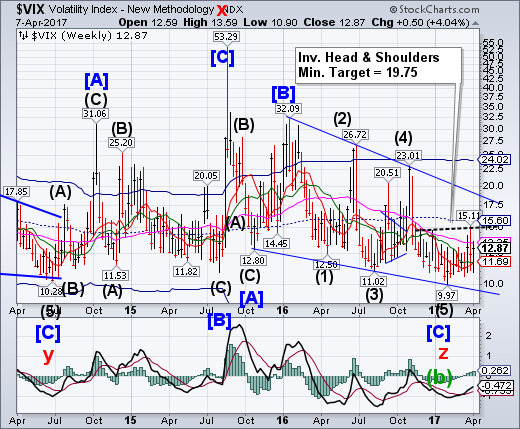
VIX consolidated, pulling back to the bottom of its range before rising to challenge Long-term resistance at 13.35. Once above it, the next target may be the inverted Head & Shoulders neckline at 15.11.Abuy signal has been made above its Intermediate-term resistance at 11.72.
A breakout above the neckline suggests that the Ending Diagonal formation may also be at risk of a breach. An actual change in long-term trend may occur above the top trendline of the 15-month long Ending Diagonal formation at 18.50.
(ZeroHedge) Today, the WSJ picks up on this idea, and looks at a possible "feedback loop" scenario in which selling of volatility leads to even more selling of volatility, resulting in a market in which the VIX appears oddly disconnected from prevailing nervous sentiment. According to the WSJ's Jon Sindreau, the theory, advanced by several money managers, bankers and analysts:
describes a type of feedback loop in which calm markets make selling insurance against sharp swings in asset prices profitable, which makes the markets more calm, which then makes selling insurance yet more attractive. And on and on.
SPX closes beneath a trendline.
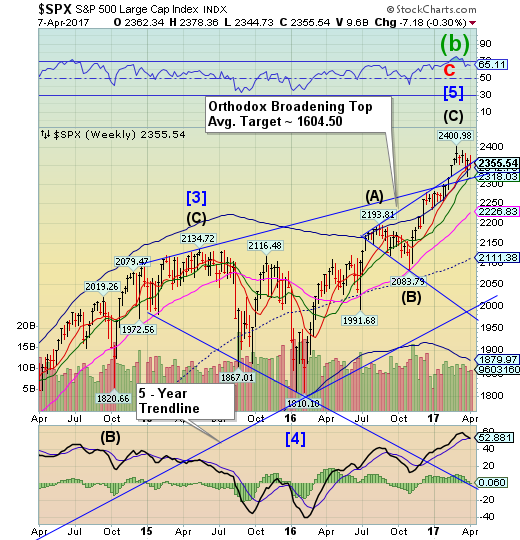
SPX bounced from its Cycle Top support at 2342.79, closing beneath the trendline of the Orthodox Broadening Top near 2360.00. The SPX is on an aggressive sell signal. A break of Intermediate-term support at 2318.03 may send the SPX to its cycle Bottom at 1879.97, or possibly lower. The Cycles Model forecasts weakness in equities for the entire month of April.
(CNBC) Stocks closed flat Friday as investors parsed through a mixed employment report, a U.S. airstrike in Syria and comments from a top Federal Reserve official.
Talking at the Princeton Club of New York, New York Fed President William Dudley said the U.S. should consider small adjustments to the Dodd-Frank law, which toughened oversight for financial institutions.
"No one wants to be on the wrong side of this deregulation trade," said Nick Raich, CEO of The Earnings Scout. The prospects of deregulation have been a boon for equities since the U.S. election.
NDX makes a new all-time high.
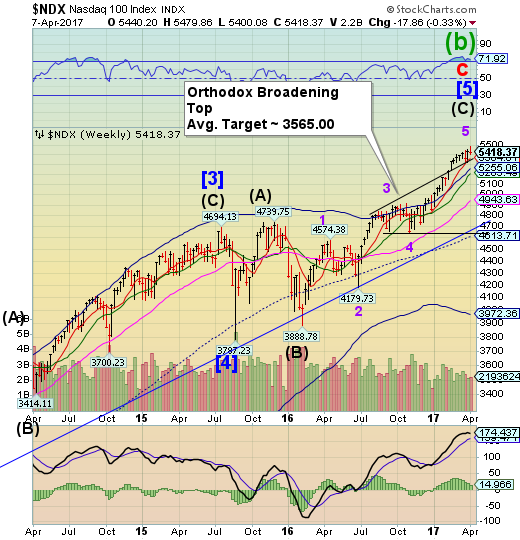
NDX pulled back from a new high on Wednesday, remaining above the Orthodox Broadening Top and Short-term support at 5365.00.A loss of that support may create a sell signal in the NDX with a subsequent decline testing lower supports. A decline beneath mid-Cycle support at 4613.71 may bring a potential change of trend with it.
(ZeroHedge) According to Bank of America (NYSE:BAC)'s Michael Hartnett, citing EPFR data, in the latest week through April 5, there were $7.4BN in outflows from equities, the largest in 40 weeks. This consisted of $3.6bn in ETF outflows - largest in 40 weeks & first outflows YTD vs. $3.8bn mutual fund outflows.
By size & style: 3rd straight week of outflows from U.S. value funds ($1.7bn), largest outflows from US growth in 10 weeks ($2.0bn); $0.9bn outflows from U.S. small caps & chunky $10.3bn outflows from US large caps (largest in 82 weeks)
By sector: inflows to tech ($0.8bn, 5 straight weeks), materials ($0.2bn), utilities ($0.3bn), real estate ($0.2bn), infrastructure ($0.1bn); outflows from energy ($0.6bn, largest in 29 weeks), financials ($0.3bn), consumer ($0.2bn), healthcare ($0.1bn)
High Yield Bond Index violates Short-term support.
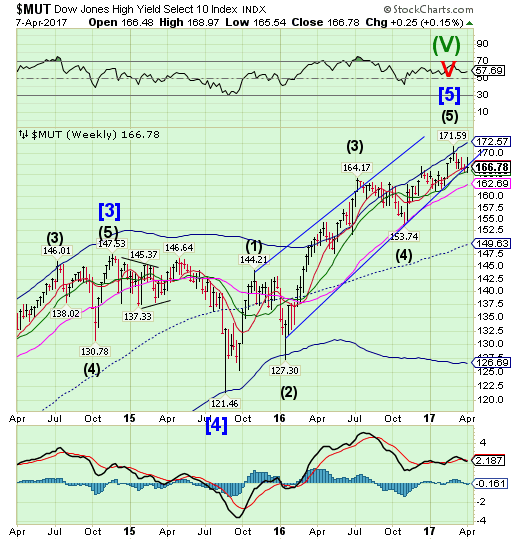
The High Yield Bond Index rallied into Wednesday, then gave back enough to close the week beneath Short-term support and the Ending Diagonal trendline at 166.96. This confirms the sell signal in high yield bonds. The Cycles Model suggests weakness ahead that may last the entire month of April.
Investors are returning to the world’s second-biggest junk-bond exchange-traded fund after pulling out nearly $2 billion over the last year.
But are they planning to stick around? The answer may be in the oil market.
State Street Corp (NYSE:STT).’s SPDR Barclays (LON:BARC) High Yield Bond (NYSE:JNK) averted the worst month in its history with a rush of inflows last week. The fund, which goes by the ticker JNK, still lost a hefty $926 million in assets in March, leaving it with just under $11.5 billion. It’s had only five worse months since its inception in 2007. And the outflows continued this week as a new month began. In the past 12 months, JNK has lost $1.8 billion of assets.
USB still consolidating
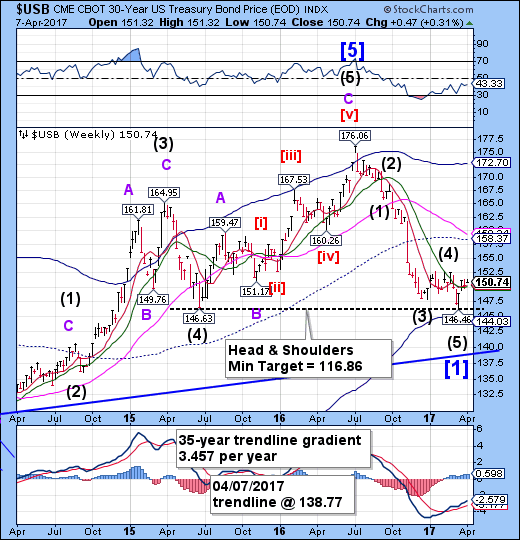
The Long Bond remains in a consolidation patternabove Intermediate-term support at 150.09. The Cycles Model now suggests an extended period of strength may extend through the month of April.The mid-Cycle resistance at 158.37 still appears to be the target, but it may go higher.
U.S. government debt prices initially rose on Friday as investors digested the decision of President Donald Trump to launch strikes against a Syrian airfield and a soft jobs report.
Later in the trading day, bond prices dropped after New York Federal Reserve President William Dudley said the U.S. should consider limited adjustments to multiple financial reforms put in place following the financial crisis.
The U.S. economy added 98,000 jobs last month, well below the expected gain of 180,000. The unemployment rate fell to 4.5 percent. Elsewhere, wholesale trade data showed inventories rose 0.4 percent, more than expected.
The euro is at the trendline.
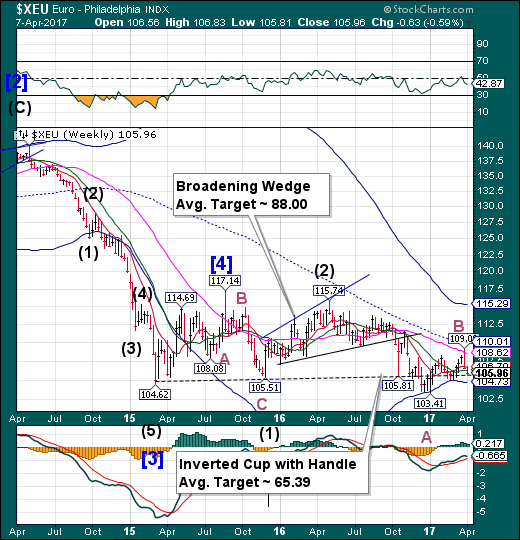
The euro declined to the Lip of the Cup with Handle formation today, but may bounce again. The Cycles Model suggests that a Master Cycle low may have been made on Friday from which a short-term rally may emerge.
The International Monetary Fund will release its outlook for the global economy on April 10, and the forecasts are likely to reflect expectations for faster growth in 2017 and 2018, even though there are political risks in the European Union from the recent implementation of Article 50 by the UK government, as well as from the potential ascension of nationalist parties on the Continent.
Stronger growth is likely to bring more inflation, and central banks do not put their mandates permanently on hold in the face of geopolitical risks. Growth and inflation remain the core missions of central banks and the key drivers of their policies. As such, markets may be discounting the potential for the European Central Bank or the Bank of England to tighten monetary policy. And if they are, that suggests the euro and the pound are undervalued.
Euro Stoxx opens higher, but closes lower.
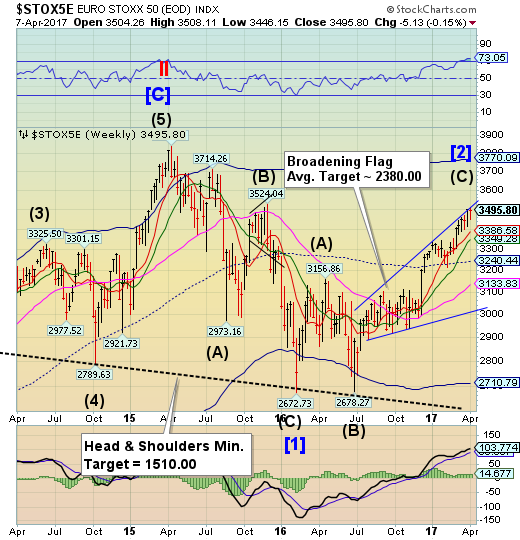
The Euro Stoxx 50 Index opened the week at a new retracement high, but pulled back on Thursday, ending the week at a loss. On Monday it achieved Wave equality, suggesting the rally may be over.
European stocks ended the session little changed as investors weighed mixed labor-market data and the U.S. military strike against Syria.
The Stoxx Europe 600 Index rose 0.1 percent at the close, after earlier sliding as much as 0.5 percent. Miners and telecommunications companies led losses, while personal and household-goods shares advanced. The European benchmark ended the week little changed after a 1.2 percent advance last week.
The yen consolidates again.
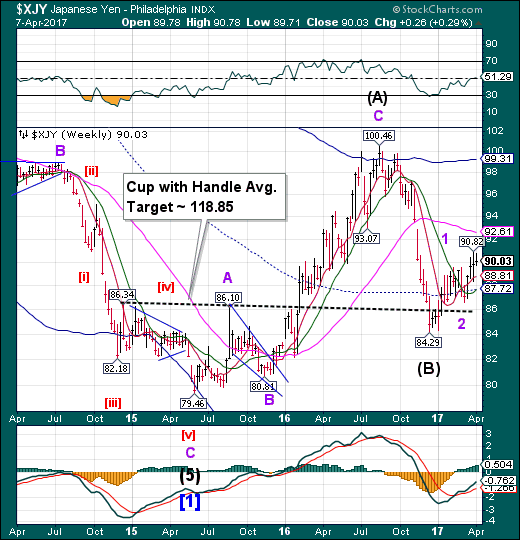
The yen had an inside week of trading, while closing higher for the week. This action confirms the buy signal in the yen. The Cycles Model now calls for strength through the end of the month.
As U.S. warships rained Tomahawk missiles onto a Syrian airbase Thursday night, currency traders began positioning themselves for safety.
It was not, however, the dollar that benefited. It was the yen.
It’s an odd turnabout. The yen, after all, represents the economy with the world’s greatest debt burden (in terms of debt to GDP). The yen, as well, is the sacrificial lamb in Japanese government’s plan to revitalize a long-moribund economy by continually printing currency.
And yet, the moment that global troubles bubble up, the world’s currency traders reflexively rush into the yen.
The Nikkei continues its decline.
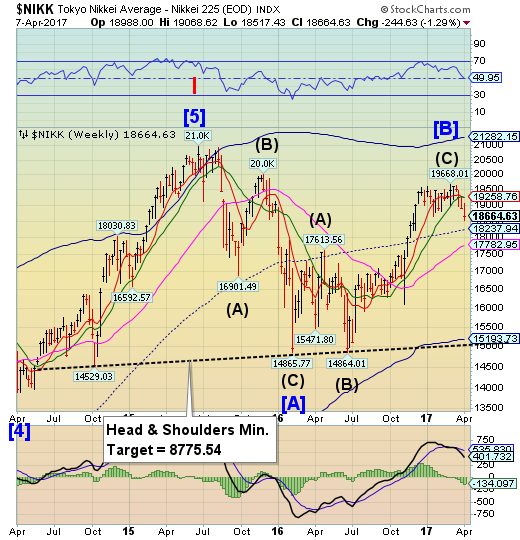
The Nikkei continued its decline, while gathering downside momentum. While it may pause on its way, the Cycles Model suggests the decline may last through the end of the month. Two probable supports on the way may be the mid-Cycle support at 18237.94 and Long-term support at 17782.95.
Japan's Nikkei share average hit a four-month low on Friday after a U.S. missile strike on Syria hurt broader risk sentiment.
The Nikkei was down 0.1 percent at 18,577.92 after slipping to as low as 18,517.43, its weakest since Dec. 7.
The index had risen as much as 1 percent earlier in the session, getting a lift from an initially weaker yen and overnight gains by Wall Street shares.
But stocks made an about-turn as risk sentiment quickly soured on news that the United States had launched cruise missile strikes on an airbase in Syria, responding to a deadly poison gas attack that Washington has blamed on Syrian President Bashar al-Assad's forces.
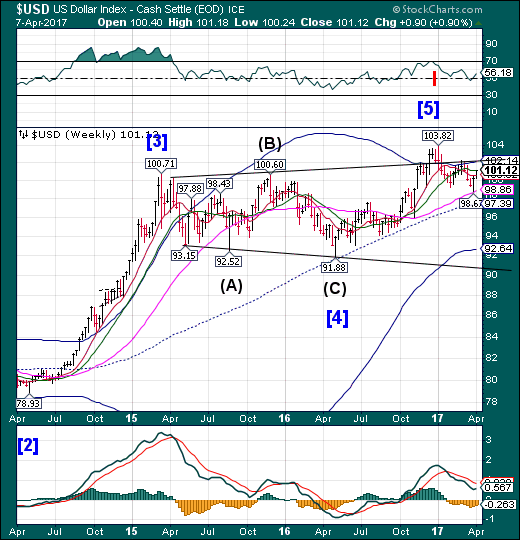
USD challenged Intermediate-term resistance at 101.12 and closed there. USD retraced nearly 70% of its prior decline, making the rally complete or nearly so. There is much work to be done on the downside, as technical support has been broken.
Speculators further reduced bullish bets on the U.S. dollar, pushing net longs to their lowest level since late February, according to Commodity Futures Trading Commission data released on Friday and calculations by Reuters.
The value of the dollar's net long position totaled $14.67 billion in the week ended April 4, down from $15.27 billion the previous week. Investors have reduced long dollar bets for a second straight week and Friday's net long dollar positioning was a five-week low.
It has been an uncertain few weeks for the U.S. dollar, starting when President Donald Trump's fellow Republicans pulled their bill to overhaul the U.S. healthcare system due to a shortage of votes.
Gold challenges Long-term resistance, but disappoints.
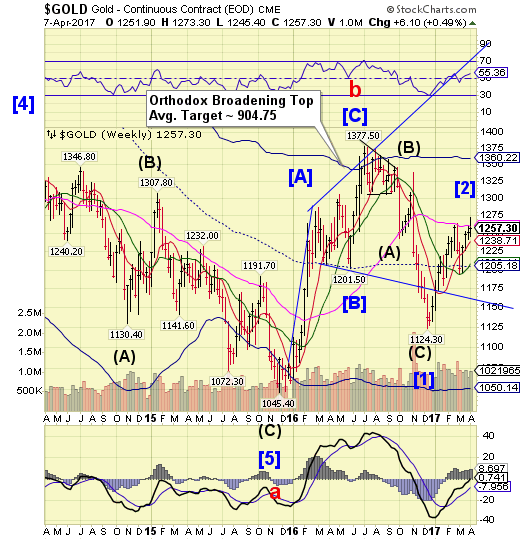
Gold challenged Long-term resistance at 1260.56 on Friday morning, thenclosed beneath it. Today was the last day this could have happened and still keep the left-oriented Cycle pattern needed for a decline. Both the Cycles Model and Orthodox Broadening Top pattern anticipate the decline to resume with only short-term bounces until it reaches its target illustrated on the chart.
Gold jumped to its highest level since November after the release of the March jobs report, but soon gave up its gains to settle just slightly higher on the day.
"On a technical basis, today's a disappointing day," Matt Maley, equity strategist at Miller Tabak, commented Friday on CNBC's "Power Lunch."
Maley explained that with their morning spike to $1,273.30, gold futures managed to rise decisively above their 200-day moving average. However, gold futures settled a bit below that mark, at $1,257.30, and slid a bit further into the equity close — in a move that was consonant with an overall snapback reaction once it was concluded that the jobs report didn't actually indicate a weakening economy.
Crude bounces from the neckline.
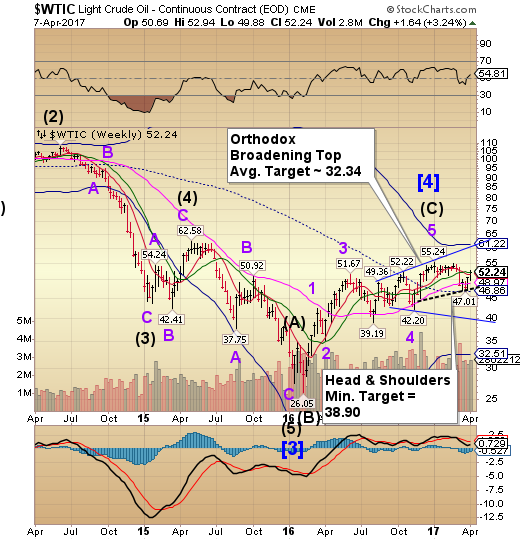
Crude challenged its Intermediate-term resistance at 52.36 before closing beneath it. The spike higher was a bit of a surprise, considering that an important low may be made in the next two weeks.
Oil prices rose on Friday, trading near a one-month high and closing the week up 3 percent after the United States fired missiles at a Syrian government air base, raising concern that the conflict could spread in the oil-rich region.
The toughest U.S. action yet in Syria's six-year-old civil war has heightened geopolitical uncertainty in the Middle East. This supported oil futures, along with signs of higher U.S. demand.
Carl Larry, oil and gas consultant at Frost and Sullivan, said:
It's back to the old adage of don't go home short the weekend. There's a lot going on here: Syria and talks with China.
Shanghai Index bounces to Intermediate-term resistance.
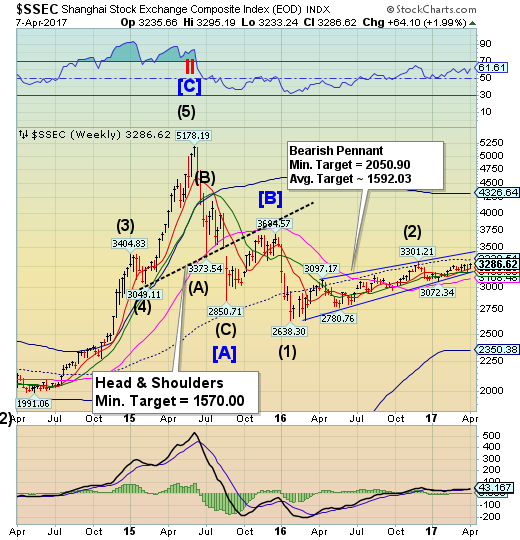
The Shanghai Index bounced to Intermediate-term resistance at 3286.06. Short-term support is at 3233.36. The index continues to bounce between these two critical support and resistance lines. The trendline also lies at Short-term supportwhich, when broken, may lead to a sell-off.The Cyclical strength may drop off by mid-week.
Today’s China-U.S. summit meeting is an event that could also have enormous implications - in both directions. As Bloomberg's Richard Breslow notes, one can't help but be intrigued by the fact that while everyone is looking at the S&P 500, this morning the Shanghai composite traded at its highest level of the year.
Notably, the Dollar relationship to China's currency relative to the rest of the world's relationship to the yuan is following a very similar pattern to last year's 'Shanghai Accord' - stronger Yuan vs USD as China weakens its basket against all majors. Fooling Trump et al. that China is 'not' devaluing?
The Banking Index consolidates beneath support/resistance.
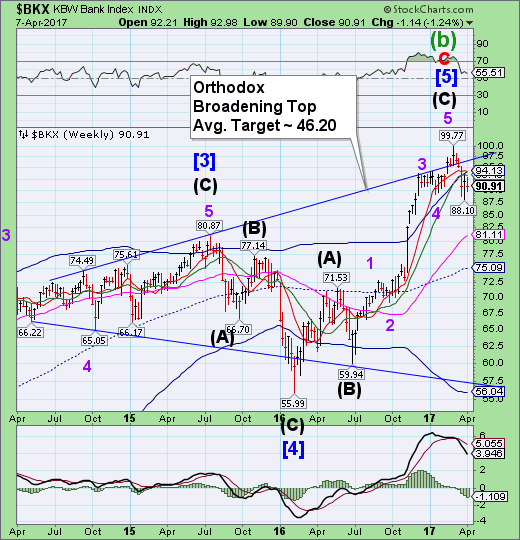
BKX probed at Intermediate-term resistance at 93.40 on Monday, but could not overcome it. The sell signal remains. Serious investors may be well served to sell any rally rather than buy the dip, as the decline may resume next week.
Four months ago we showed that according to 6 month EUR/CZK forwards - driven by a recent surge in Czech inflation - the market was convinced the Czech central bank would end its Koruna peg to the Euro some time before the summer.
As ING stated at the time:
It shows that the market is positioning against the CNB floor more intensively, as accelerating inflation is increasing the odds of the approaching exit.
The Dutch bank said it expected the currency regime to be scrapped around April or May, with annual inflation forecast to climb from 1.5 per cent to 1.9 per cent in December – close to the central bank’s 2 per cent target.
One of the great misunderstandings about the financial crisis is the role that repealing the Glass-Steagall Act played. This is newly relevant, as there has been interest from White House economic adviser Gary Cohn in restoring the Depression-era legislation. President Donald Trump is said to want to keep his campaign promise to restore Glass-Steagall as well.
As someone who (literally) wrote a book on the subject, it’s a good time to revisit the actual impact of the repeal, and what its resurrection might mean to banks, investors, Wall Street and taxpayers.
We begin by recounting why we had Glass-Steagall in the first place: the 1933 legislation divided banking into Main Street and Wall Street. Perhaps the best illustration of this is J.P. Morgan & Co. When the house of Morgan was split in two, one part became JP Morgan, a commercial bank (today it's known as JPMorgan Chase & Co (NYSE:JPM).) and Morgan Stanley (NYSE:MS), a brokerage firm.
Since China's four major state-owned banks reported results last week, analysts have been cheering. Profit growth was up and non-performing loan ratios were down. Much has been made about progress in improving underwriting standards. But it would be wise to hold off on the euphoric pronouncements and to take a closer look at how the banks produced these results.
Most important, there's little sign of deleveraging. Those banks increased total loans by 10.2 percent in 2016, to $12 trillion. That means lending is still growing much faster than gross domestic product. More worrying, shadow-banking assets, such as wealth-management products, increased by 15 percent, significantly faster than loan growth.
The two sectors increasingly seem linked, suggesting that shadow-banking problems may yet become traditional-banking problems. So far, pledges to deleverage have remained just that: pledges.
