

VIX rallied to test Long-term resistance at 16.27 before closing beneath mid-Cycle support at 14.15. The Cycles Model suggests Cyclical strength may dominate through mid-May, possibly longer. VIX may be accumulated here for the next probe higher.
(Bloomberg) Beneath the calm in global stocks lies a brittle market prone to violent spasms.
As central banks snuff out market fears for now and the brewing melt-up banishes memories of last year’s meltdown, the threat of brief but extreme price swings looms over fast-money traders.
In financial parlance, gap risk -- sudden moves with little trading in between -- is growing, according to HSBC Holdings Plc (LON:HSBA).
Blame robots and electronic market-makers for creating an illusion of liquidity that can vanish on a dime. Post-crisis regulation, or the boom in volatility-sensitive investing.
SPX ekes out another positive week

SPX broke above the 2.5-year trendline originating from the 2016 election in its fourth week. It also breached the September 21, 2018 high on an intraday and closing basis. Strategists consider that point as a breakout to more all-time highs. However, it may be forming “Point 5” in the Orthodox Broadening Top formation with the new high. A sell signal may be generated beneath Short-term support at 2859.51. “Point 6” lies beneath the December 26 low.
(CNBC) Stocks rose on Friday, rebounding from a two-day loss, as data showed U.S. job creation was stronger than expected in April.
The Dow Jones Industrial Average rose 197.16 points to 26,504.95, while the S&P 500 rose nearly 1% to 2,945.64, posting its biggest gain since April 1. The Nasdaq Composite climbed 1.6% higher to hit a record high of 8,164. Shares of Amazon got a boost from an investment by Warren Buffett’s Berkshire Hathaway.
NDX stalls near the top

NDX has reached a new weekly high on a closing basis, but the April 24 intra-day high still stands. The Orthodox Broadening Top is still in play. Cyclical strength is due to run out this weekend. A sell signal awaits beneath Short-term support at 7474.82.
(WashingtonPost) Warren Buffett has repeatedly said he was an “idiot” for not buying stock of Amazon.com Inc (NASDAQ:AMZN). when the company was younger and its share price was lower. Now comes news that his Berkshire Hathaway Inc. (NYSE:BRKa) plopped some shares of the e-commerce giant in its shopping cart, at a time when Amazon is shedding some but not all of the characteristics that made the Oracle (NYSE:ORCL) of Omaha shun technology companies for years.
One of the investing lieutenants at Berkshire Hathaway — not Buffett himself, he stressed to CNBC — opted to buy Amazon shares for the firm in recent months, Buffett said on Thursday. He was very insistent that it wasn’t him doing the Amazon buying, perhaps because Buffett’s reputation as a lifetime proponent of value investing would be dinged by a purchase of Amazon stock.
High Yield Bond Index challenges Short-term support

The High Yield Bond Index continued its decline, challenging Short-term support at 209.90. A further decline confirms the signal. This concludes a probable point 5 of an Orthodox Broadening Top. Point 6 may be the Cycle Bottom at 161.03. The Cycles Model warns of a probable decline through mid-April.
(Bloomberg) Hedge funds and other investors are reviving a type of securitized product that blew up during the financial crisis. This time around they’re convinced that the structures will not only weather the next downturn, but might even profit from it.
Money managers are resurrecting collateralized debt obligations that bundle risky bonds and loans into new, higher-rated securities. Issuers such as Anchorage Capital Group and Fortress Investment Group are betting tweaks to the products will allow them to keep enough cash on the sidelines that, when the next slowdown hits, they’ll be able to swoop in and buy the most beaten-down debt on the cheap.
Treasuries consolidate at Short-term support

The 10-year Treasury Note Index consolidated at Short-term support at 12363. It remains on a buy signal with a potential target at the Cycle Top resistance at 127.83. The Cycles Model suggests the rally may continue through mid-June.
(ZeroHedge) While the rest of the world is distracted by the plummeting unemployment rates and trade deal hype, a funny (well not so funny) thing happened in the short-term funding markets in the world's reserve currency.
As we noted previously, something unexpected has been going on in overnight funding markets: ever since March 20, the Effective Fed Funds rate has been trading above the IOER. This is not supposed to happen.
The euro caught in a downward spiral
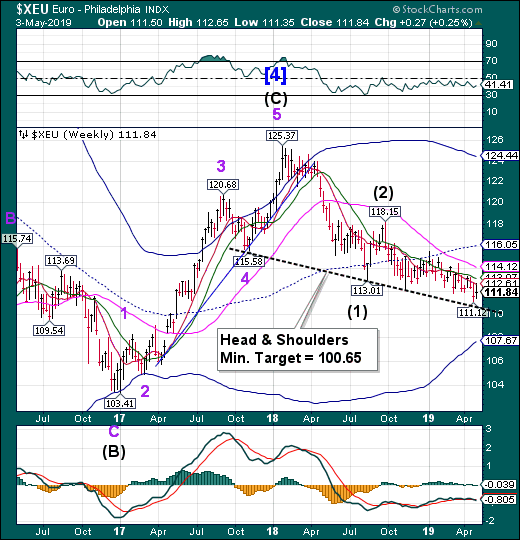
The euro plunged lower this week and may be capable of breaking down beneath its Head & Shoulders neckline at 110.00. If so, the Euro may continue its decline to its target in mid-May.
(EuroNews) Euro zone inflation surged beyond expectations last month, mild relief for the European Central Bank, even if much of the jump was likely related to seasonal effects due to the timing of Easter.
Inflation in the 19 countries sharing the euro accelerated to 1.7 percent in April from 1.4 percent a month ago, beating expectations for 1.6 percent, Eurostat data showed on Friday.
More crucially, underlying prices excluding food and energy, a figure closely watched by the ECB, picked up to 1.3 percent from 1 percent, erasing a worrisome dip a month earlier and hitting its highest rate since October on a jump in services costs.
Euro Stoxx makes a new retracement high

Note: StockCharts.com is not displaying the Euro Stoxx 50 Index at this time.
The EuroStoxx 50 SPDR launched higher from mid-Cycle support at 37.78 in a final burst of strength that may expire this weekend. A sell signal awaits beneath Short-term support at 37.30. The Cycles Model suggests 3 or more weeks of decline may lie ahead.
(Reuters) - European shares rose on Friday, recovering from their worst day in six weeks with support from robust jobs data from the United States and strong results from Adidas (DE:ADSGN) and HSBC.
The pan-European STOXX 600 index closed up 0.4 percent, rising up to 0.6 percent after strong U.S. jobs data, before trading back at mid-day levels. On the week, the index fell 0.2 percent after two week of gains.
Data on Friday showed that U.S. job growth surged in April and the unemployment rate dropped to a more than 49-year low of 3.6 percent, pointing to sustained strength in economic activity
The yen closes above Short-term support
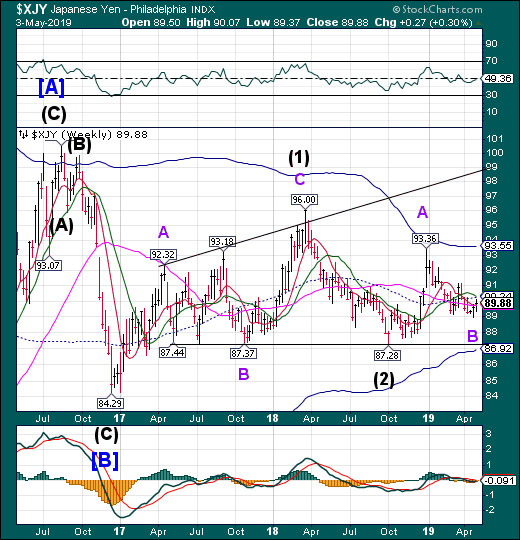
The yen rose higher, closing above Short-term support at 89.79. A further rally reinstates the buy signal. The Cycles Model suggests a rally in strength through the end of May.
(JapanToday) Asian finance chiefs have agreed to consider the Japanese yen and Chinese yuan for currency swap arrangements in addition to the U.S. dollar in an effort to deal with possible financial crises, while also rejecting protectionism amid U.S.-China trade tensions.
The addition of local currencies to the swap agreements is "one enhancement option" for the future, the finance ministers and central bank governors of Japan, China, South Korea and the Association of Southeast Asian Nations said in a joint statement following their meeting in Fiji.
To prevent a repeat of the 1997 Asian currency crisis, the countries in 2000 launched the Chiang Mai initiative, U.S. dollar-denominated multilateral currency swap arrangements under which member countries facing short-term liquidity shortages can access a pool of dollars in exchange for their currencies.
Nikkei market action forms an “island”

The Nikkei consolidated in an “island” formation above Long-term support at 21897.72. There is some concern that the island may have been formed by an exhaustion gap. If so, the Nikkei may gap down beneath Long-term support, creating a sell signal when the market reopens.
Note: The Japanese markets are closed until May 6.
(WashingtonPost) It was supposed to be a period of joyous national celebration, the Golden Week public holiday, which has been extended this year to celebrate the ascension of a new emperor to the Chrysanthemum Throne.
So why are so many people in Japan miserable and stressed?
U.S. dollar tests Short-term support

USD reversed down to test Short-term support at 96.90. The anticipated Master Cycle high occurred on April 26 with a brief spurt of strength on Thursday. It appears that Dollar weakness may prevail over the next three months.
(Xinhua) -- U.S. dollar decreased in late trading on Friday, as investors digested a mixed batch of U.S. economic data, amid worries over slowing activities in the manufacturing sector.
The Institute for Supply Management's non-manufacturing index declined to 55.5 percent in April, 0.6 percentage point down from 56.1 percent in March, which marks the slowest reading since August 2017, said the not-for-profit professional supply management organization on Friday.
The reading fell far short of an estimate of 57.5 percent by economists polled by MarketWatch.
The disappointing data has partially offset robust U.S. job statistics in April.
Gold retests the neckline
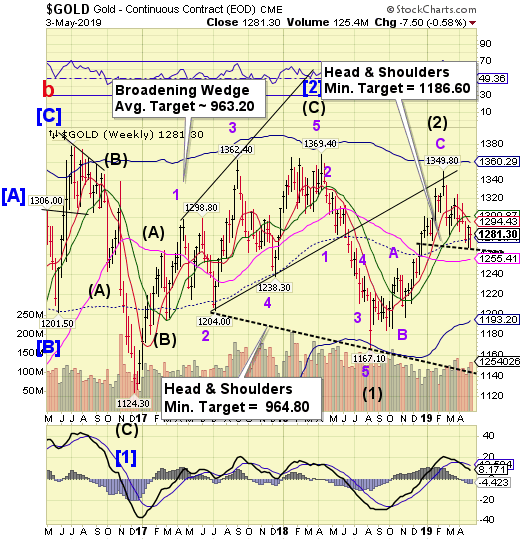
Gold retested the Head & Shoulders neckline and bounced again, stopping beneath Short-term resistance at 1294.43. The week of strength came and went without retesting round number resistance at 1300.00. The neckline has been repositioned for a new sell signal beneath it.
(MarketWatch) Gold futures climbed Friday, recouping some of the sharp loss from a day earlier that sent prices to their lowest level of the year, but the precious metal still registered a loss for the week—their fifth in six weeks.
Data Friday revealed that the U.S. created a larger-than-expected 263,000 new jobs in April, which helped the unemployment rate fall to a 49-year low of 3.6%.
In reaction, however, the dollar edged lower, with the ICE (NYSE:ICE) U.S. Dollar Index DXY, -0.36% down 0.3%, contributing to a weekly decline so far of 0.5% as gold futures settled. Weakness in the buck provides support for dollar-denominated gold.
Crude tests Long-term support
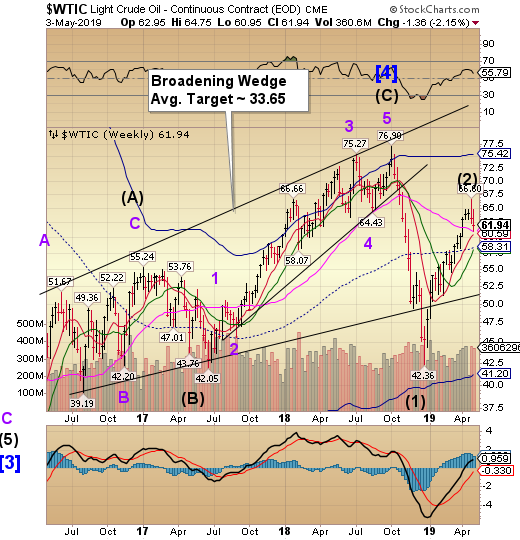
Crude declined further this week, testing Long-term support at 60.59. Confirmation of a sell signal lies beneath that level. The expected period of strength only lasted until Tuesday. Since this is an inversion, it may show strength on the downside.
(OilPrice) Brent Crude futures prices for later this year suggest that the oil market is undersupplied, despite recent rises in U.S. crude oil inventories that sent spot oil prices plunging in the past two days, Reuters market analyst John Kemp argues.
Although U.S. commercial crude oil inventories have been rising in recent weeks, they have been doing so less than normal for this time of the year although U.S. refineries have been undergoing heavy spring maintenance to be ready to process fuel in the fall and winter of 2019, just ahead of the new low-sulfur requirements for shipping fuels, Kemp writes.
Oil prices plunged on Thursday to the lowest in a month after U.S. government data showed on Wednesday that inventories hit their highest since September 2017 and production soared to another record level last week.
Shanghai Index on a sell signal

The Shanghai Index plunged beneath Short-term support at 3117.47 this week, confirming its sell signal. While there may be a bounce during options week, the longer term direction is down. The Cycles Model suggests the decline may last through the end of May.