REVIEW
The market started the week at SPX 2459. After a tick up to SPX 2463 on Monday, the market pulled back to 2450 on Tuesday. After that it rallied to an all-time high of SPX 2478 on Thursday. Then pulled back to SPX 2465 on Friday before ending the week at 2373. For the week the SPX/DOW were mixed, and the NASDAQ 100/NASDAQ Composite gained 1.1%. Economic reports were slightly positive. On the downtick: the NY/Philly FED, the NAHB, and the Q2 GDP estimate. On the uptick: export/import prices, housing starts, building permits, leading indicators, plus jobless claims improved. Next week’s reports will be highlighted by Q2 GDP (est. 2.9%) and the FOMC meeting.
LONG TERM: uptrend
With SPX GAAP earnings rising two quarters in a row at +6.5% growth, the true trailing PE multiple of the SPX has fallen from 26.5 to 24.5. Historically this is a fairly high level, only exceeded five times in the past 90-years: 1934, 1992, 1999, 2002 and 2009. Note the last two were bear market low years, while the first three were not bull market top years. Adding to the recent earnings growth momentum is the expected USD bear market. The Euro, Swiss franc, Aussie dollar have already confirmed new bull markets. A declining USD is a tailwind to US equity earnings. A declining USD will: drive up Internationals profits, stabilize and push higher commodities like energy, increase import prices which will help inflation, this will drive up FED rates, which will help the financials.

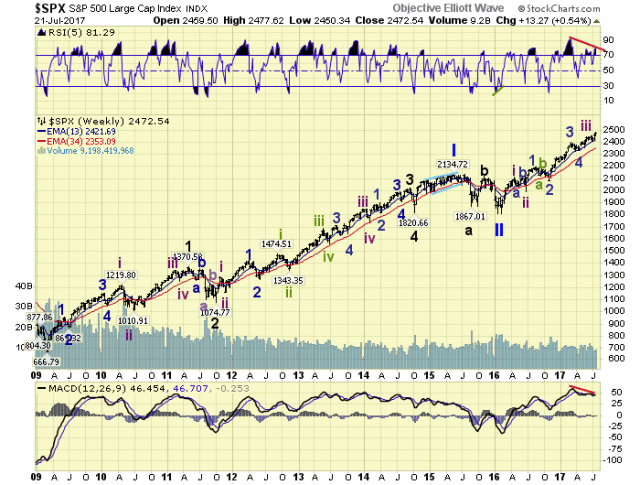
The long-term count remains unchanged. The Primary wave II bear market ended at SPX 1810 in February, 2016. A Primary wave III bull market is underway, and Major wave 1 has been unfolding. Intermediate waves i and ii of Major 1 ended in the spring of 2016. Minor waves 1 and 2, of Int. iii, ended in the fall of 2016. Minor waves 3 and 4, of Int. iii, ended in the spring of 2017. Minor wave 5, of Int. iii, ended in June 2017, or is extending into five Minute waves.
MEDIUM TERM: uptrend
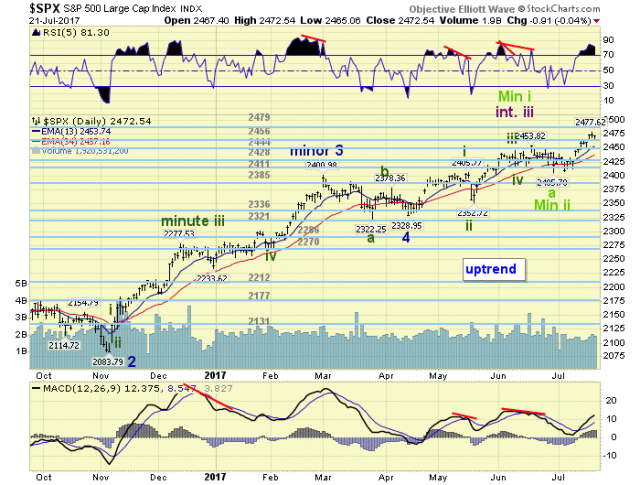
After what appeared to be the Minor wave 5 uptrend, from SPX 2329-2454, ended in June. The SPX declined to 2408 with one of the three smallest downtrends in the past 100-years. The two others were in the spring of 1925, and the fall of 1944. Historical! After that the SPX reversed into an uptrend and has already made new all-time highs to 2478.

This suggests the current uptrend is either a B wave of Intermediate wave iv, which would follow a Minor 5/Int. iii top. Or Minor 5 itself is extending into five Minute waves: Mte i SPX 2454, Mte ii SPX 2408, Mte iii underway. Since B waves can be eliminated once they reach 1.618 times the A wave, the OEW 2479 pivot range is the deciding factor. If this uptrend fails to break that range, then it is a B wave of Intermediate iv. If it breaks the range then Minute iii, of Minor 5, is underway. Stay tuned. Medium term support is at the 2456 and 2444 pivots, with resistance at the 2479 and 2525 pivots.
SHORT TERM
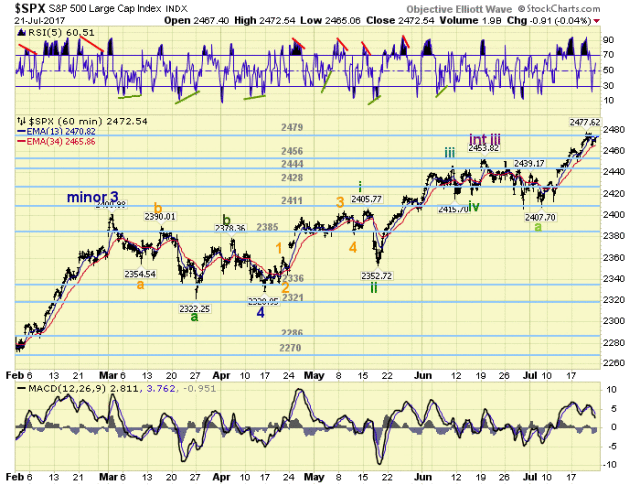
The advance of this uptrend, thus far, does look impulsive. On our quantitative short-term count we have three waves up from SPX 2408: 2432-2413-2478. A fairly strong third wave. A smaller short-term count displays an unquantified six wave sequence: 2432-2413-2464-2650-2478-2465.

Both of the counts can become a corrective three waves if the uptrend ends around current levels with a marginal new high. Then the C wave down, of Int. iv would take over. If the market breaks through the OEW 2479 pivot, Minute iii is underway, and Minor 5 is subdividing and extending. Short term support is at the 2456 and 2444 pivots, with resistance at the 2479 and 2525 pivots. Short term momentum ended the week just above neutral.