REVIEW
The week started at SPX 2416. After a pullback to SPX 2404 by Wednesday morning the market rallied to all-time highs on Thursday/Friday, hitting SPX 2440. For the week the SPX/DOW gained 0.80%, and the NDX/NAS gained 1.55%. Economic reports for the week were mixed.
On the downtick: consumer sentiment, the Chicago PMI, pending home sales, construction spending, monthly payrolls, the WLEI, the Q2 GDP estimate, plus weekly jobless claims and the trade deficit rose. On the uptick: personal income/spending, the CPI, Case-Shiller, the ADP, ISM manufacturing, plus the unemployment rate declined. Next week’s reports will be highlighted by ISM services and factory orders.
LONG TERM: uptrend
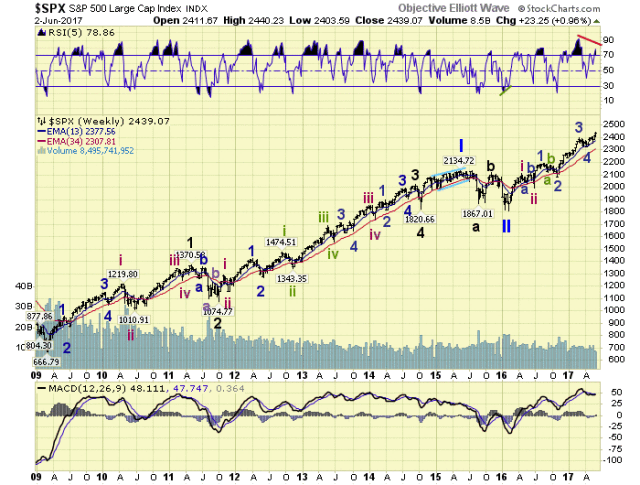
After breaking out of the SPX 2400 area late last week, the bull market headed into unchartered territory this week. Even the DOW joined the party and made all-time new highs. With the TRAN in an uptrend, it looks like the cyclicals are now joining the techs as they continue to extend higher in a seven month uptrend.

The bull market count remains unchanged. A Primary II low in February 2016. Intermediate waves i and ii, of Major 1, of Primary III, completed in the spring of 2016. Minor waves 1 and 2, of Intermediate iii, completed in the fall of 2016. Minor waves 3 and 4 completed in the spring of 2017. And Minor wave 5 is currently underway. When Minor 5 concludes, Intermediate iii will also conclude, then Intermediate wave iv could generate the biggest correction of this bull market thus far. The largest correction of this bull market, thus far, have been about 120 points.
MEDIUM TERM: uptrend
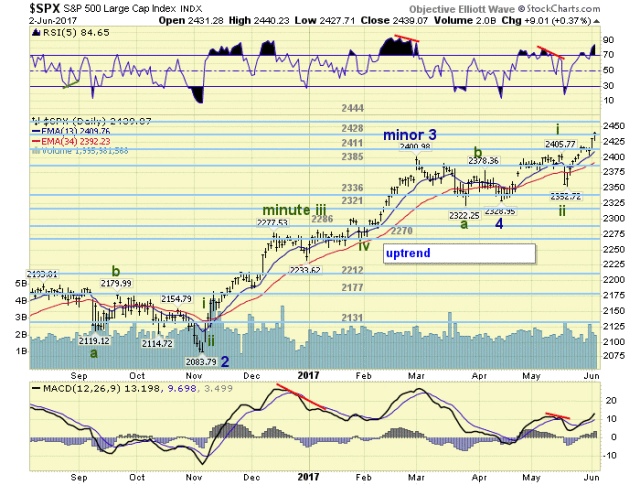
This Minor wave 5 uptrend began in mid-April with a failed flat (sign of strength) at SPX 2329. Thus far it has completed Minute i at SPX 2406, Minute wave ii at SPX 2353, and Minute wave iii is currently underway. Minute i subdivided into five waves on one timeframe, and nine waves on a lesser timeframe. Minute iii has not subdivided at all on one timeframe, and displays three waves on the lesser timeframe.

Minute iii has already surpassed the length of Minute i (87 pts. v 77 pts.). Should Minute iii subdivide like Minute i, this uptrend has a long way to go. This does not have to occur, but it could. Let’s just take it one pivot at a time and see what the short term wave structure looks like as we approach each pivot. Medium term support is at the 2428 and 2411 pivots, with resistance at the 2444 and 2479 pivots.
SHORT TERM
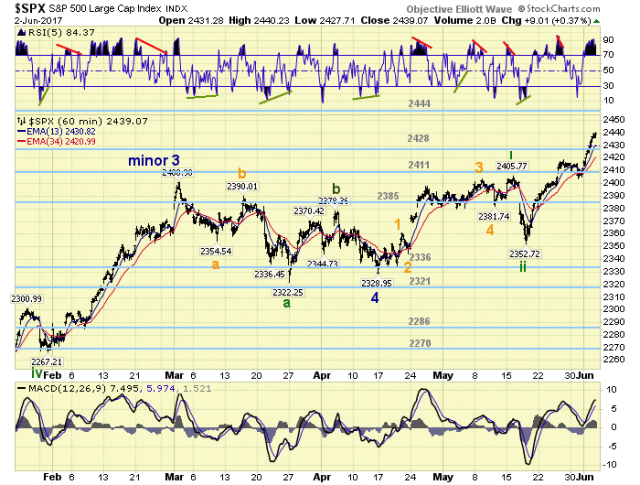
On the hourly chart we labeled five Micro waves (orange) during Minute wave i. These Micro waves were the subdivisions of the larger timeframe we use to track the short term waves. Since there have not been any subdivisions during Minute iii, on this timeframe, we have not offered any labeling yet.

We did note earlier, however, there has been one subdivision (three waves) on the shortest timeframe, and we tracking that for now. Applying this subdivision we have: wave one (2353-2419), a wave two pullback, then wave three underway (2404-2440). The third wave will equal the first wave at SPX 2470. Short term support is at the 2428 and 2411 pivots, with resistance at the 2444 and 2479 pivots. Short term momentum ended the week quite overbought.