REVIEW
The market started the week at SPX 2382. After a gap up opening on Monday the market continued to rally until it hit a new high at SPX 2419 on Thursday. After that there was a small pullback to end the week at SPX 2416. For the week the SPX/DOW gained 1.35%, and theNDX/NAZ (NYSE:NAZ) gained 2.25%. Economic reports for the week were mostly negative. On the downtick: new/existing home sales, durable goods, consumer sentiment, the Q2 GDP estimate, plus weekly jobless claims rose. On the uptick: Q1 GDP and the WLEI. Next week’s reports will be highlighted by monthly payrolls and the FED’s beige book.
LONG TERM: uptrend
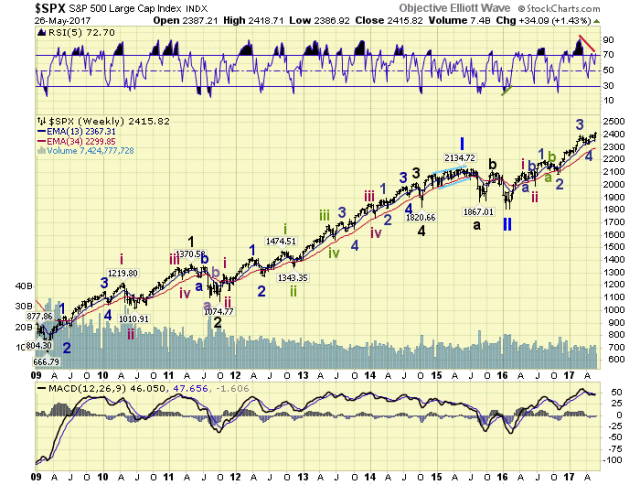
The updated count we have been using on the NAZ for a few weeks appears to be the correct one. So we updated the NDX charts to display the same Int. wave iii underway count. This coincides quite well with the SPX/DOW counts, that suggest Minor wave 5 of Int. wave iii is underway. As with nearly all fifth waves we have been observing negative divergences on their weekly charts. Will the market just ignore it, and keep going higher? Or after the short term patterns complete, will we see the largest correction since early 2016? Fourth waves (Int. iv) in recent years have been notoriously steep.

Long term the OEW SPX wave count continues too look correct. A Primary II low in early 2016, with Primary III underway. Intermediate waves i and ii ended in the spring of 2016, with Int. iii underway since then. Minor waves 1 and 2 ended in the fall of 2016, and Minor waves 3 and 4 ended in the spring of 2017. Minor wave 5, which completes Int. iii, has been underway since April.

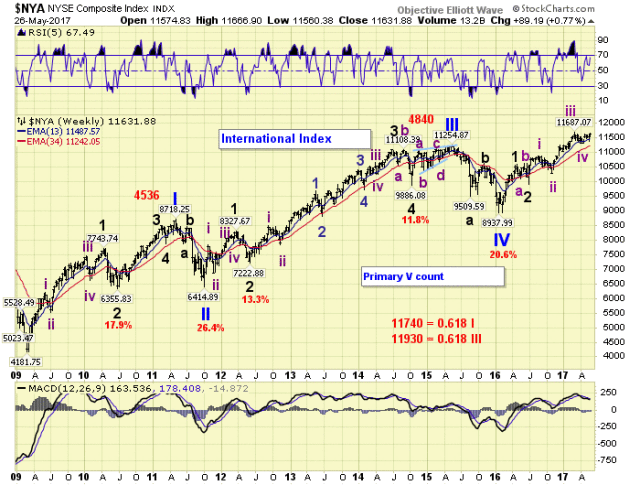
For those still holding onto the Primary V count since 2009. They may get their opportunity soon, to find out if it is correct or not. We continue to carry this alternate count on the NYSE charts. Notice that this count suggests Int. v of Major 3 is currently underway. After it completes a Major 4 correction will follow. Then Major 5 should end Primary V. This is not our preferred count, but it is preferred by most Elliott Wavers.
MEDIUM TERM: uptrend
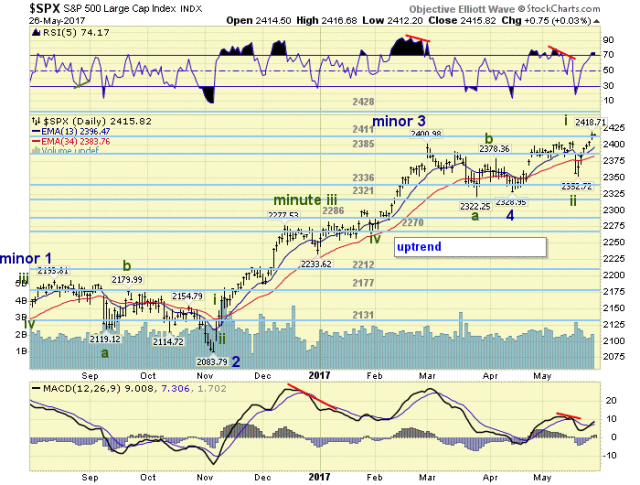
The Minor 5 uptrend, from the Minor 4 SPX 2329 low, finally broke through the SPX 2400-ish level this week. That level had kept the market in check since early-March. Minor 5 appears to be subdividing into five Minute waves: 2406-2353-2419 so far. With this rally we can now make some potential targets for the high of Intermediate wave iii.

While the market has now generated several higher OEW pivots, there are two sets of these pivots that are clustered together. Clustered pivots often offer far more resistance then standalone pivots. The first cluster is between the 2444 and 2456 pivots, the second between the 2524 and 2531 pivots. If the first doesn’t stop this uptrend, the second likely will. Medium term support is at the 2411 and 2385 pivots, with resistance at the 2428 and 2444 pivots.
SHORT TERM
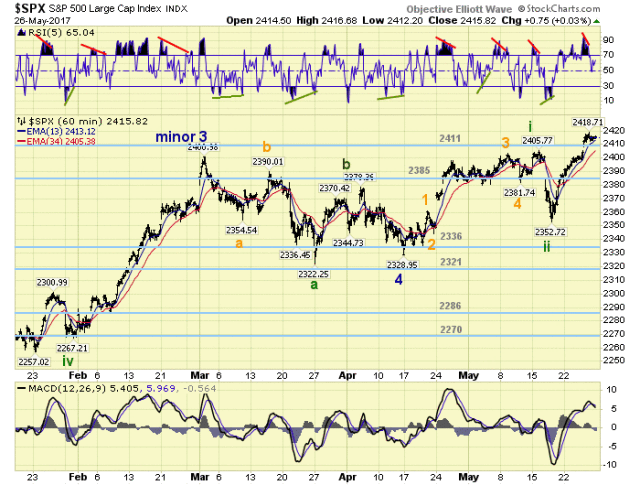
From the downtrend low at SPX 2329 we counted 5 waves up to SPX 2406 on one timeframe, and 9 waves up on a shorter timeframe. Since both were impulse patterns we expected higher prices after a pullback. The pullback, however, was much larger than expected: 2406-2353. But the market rebounded quickly by making new all-time highs the following week. As a result we upgraded the labeling to SPX 2406 Minute i, SPX 2353 Minute ii, and SPX 2419 Minute iii so far.

Minute iii has been quite steady and strong, 66-points, and it has not had a notable pullback since it began. The strongest rally during Minute i was 53-points, during the 3 of 3 portion of that wave. This suggests one of two things: (1) Minute iii may not have a pullback until it ends, or (2) Minute iii will be quite strong with subdivisions of its own. Will leave both open as possibilities. Short term support is at the 2411 and 2385 pivots, with resistance at the 2428 and 2444 pivots. Short term momentum ended the week above neutral.