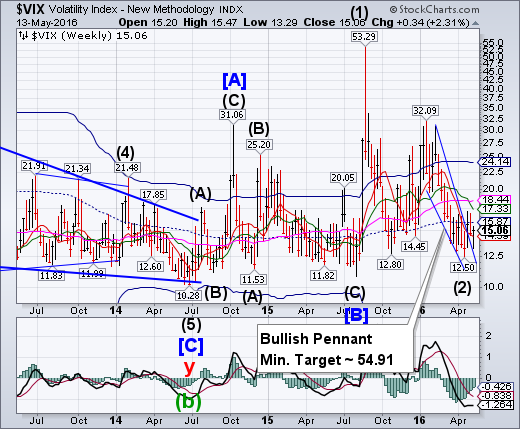
CBOE Volatility Index bounced from its Pennant formation trendline closing above its Short-term support at 14.60. This maintains a potential aggressive buy signal (NYSE sell signal). A breakout above the weekly high at 17.09 may confirm the signal.Further confirmation lies above the mid-Cycle resistance at 15.87 andIntermediate-term resistance at 17.33.
(ZeroHedge) Over the past two weeks we observed two curious, vol-related phenomena.
First, it was Tom DeMark cautioning that even as stocks have surged, the amount of iPath S&P 500 VIX Short-Term Futures Exp 30 Jan 2019 (NYSE:VXX) shares outstanding has soared to record highs, a seemingly contradictory confluence of events because it suggested that investors, traditionally "going with the market flow", are betting on a major vol reversal and furthermore the move contradicts historical shifts in VXX holdings at times of extreme market upside.
SPX retests its “shelf of support”.
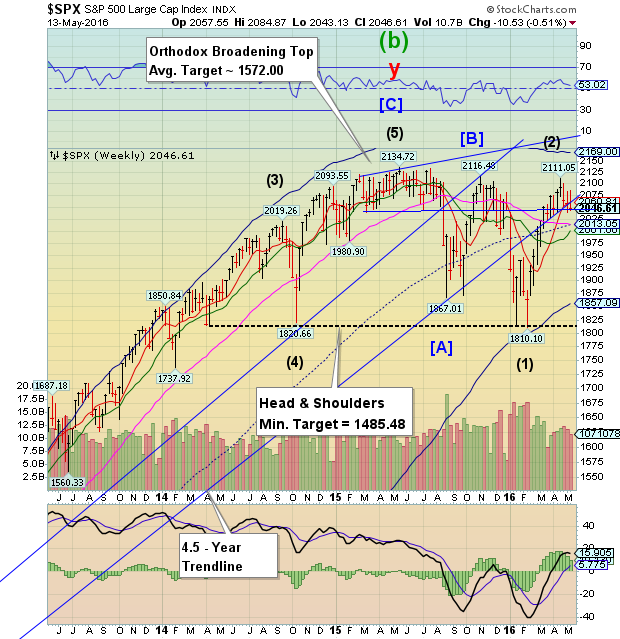
After haven broken through its 4.5-year trendline, SPX it came to rest at the Broadening Top trendline at 2044.00, another critical shelf of support. Among other things, it is the December 31 closing value for the SPX at 2043.94. A decline beneath the“shelf of support”it implies may constitute a sell signal on the SPX. Trendlines are important support areas that often attract, then repel the markets.
(Reuters) U.S. stocks fell on Friday as a decline in oil prices added to pressure from consumer companies after gloomy earnings reports from Nordstrom (NYSE:JWN) andJC Penney Company Inc Holding (NYSE:JCP) overshadowed upbeat April retail sales data.
The decline in the department stores' shares marked the end of a week that highlighted the expanding clout of Amazon.com (NASDAQ:AMZN) and the plight of brick-and mortar retailers struggling to keep up.Crude prices slipped on Friday as a strong dollar weighed and investors cashed in on gains from a three-day rally.
NDX declines, closing at Intermediate-term support.
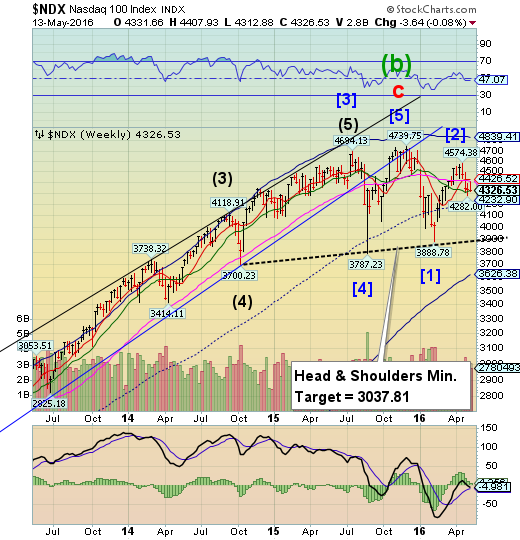
NDX closed at the bottom of its two week trading range just above Intermediate-term support at 4324.23. NDX continues to be on a sell signal after declining through Long-term support at 4426.52. The Head and Shoulders formation may be in play once NDX declines through its mid-Cycle support at 4232.90.
(ZeroHedge) On April 28, the catalyst the sent the stock price of AAPL to its post-August 25 flash crash lows, and launched a tremor not only within the Nasdaq but the broader market, was news that after several years of being AAPL's biggest cheerleader, even coming up with price targets north of $200, Carl Icahn had suddenly cooled on the China-focused growth company, and had liquidated his entire stake.
But as Icahn was selling, or just before as we don't know precisely when Icahn, who has since indicated he has turned massively bearish on the overall market, one entity was buying every AAPL share it could find. In fact, according to its latest 13F, everyone's favorite central bank that openly admits it is also a wholesale buyer of stocks (with a portfolio of some $100 billion), the Swiss National Bank reveals that in Q1 it bought another 4.1 million in AAPL shares, bringing its total to a record 14.5 milion shares.
High Yield Bond Index is making new lows.
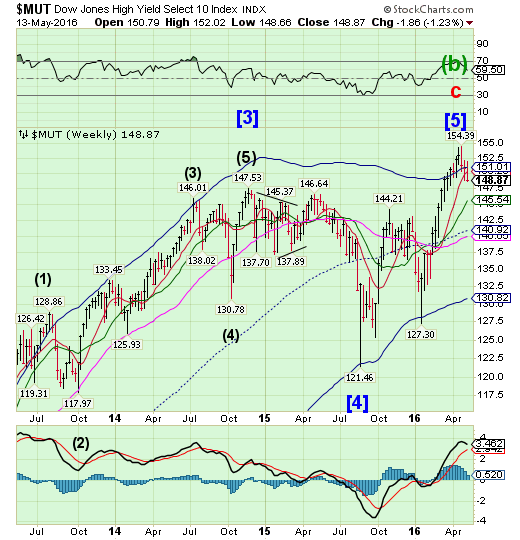
The Dow Jones High Yield Select 10 Index retested its Cycle Top support at 151.01, then declined to a new weekly closing low. It has also completed an important reversal pattern.This may be construed as a sell signal for High Yield Bonds.
(MarketRealist) High-yield bond issuance activity slowed down last week. However, the tone of the Market remained firm. According to data from S&P Capital IQ/LCD, dollar-denominated high-yield debt amounting to $3.8 billion was issued in the week ending May 6—the lowest since March 25, 2016. In the previous week, high-yield issuance was at $6.3 billion. The number of transactions was down to five last week from seven in the previous week.
Last week brought the total US dollar-denominated issuance of high-yield debt to $66.5 billion in 2016 year-to-date. This is 47.0% lower compared to the same period in 2015.
The Euro’s uptrend may be in question.
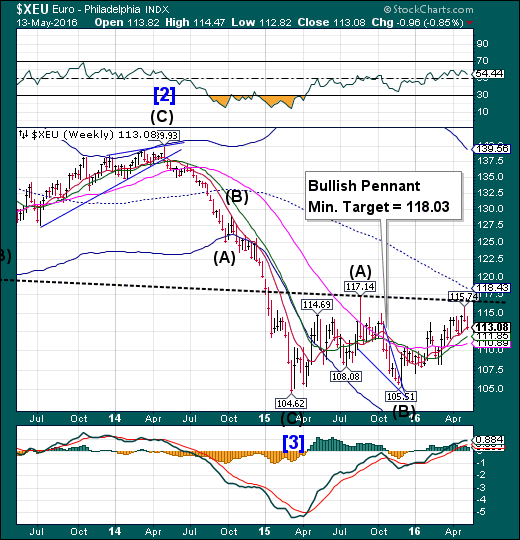
The Euro pulled back this week but is still above uptrend support at 113.04. There may be another push higher next in which it may meet its minimum Pennant objective week before a stronger pullback. The mid-Cycle resistance at 118.43 may be within reach.
(Bloomberg) Count Goldman Sachs Group Inc (NYSE:GS). among the growing list of banks abandoning their calls for the euro to reach parity with the dollar by the end of the year.
The New York-based bank joined Deutsche Bank AG (DE:DBKGn) this week in scrapping forecasts for the
common currency to slump to $1 or below in 2016, citing changed outlooks for central-bank policy. Goldman Sachs sees the euro trading at $1.05 in 12 months, up from 95 cents forecast previously, analysts led by Robin Brooks, the bank’s chief currency strategist, wrote in a note on Friday. A day earlier, Deutsche Bank, the world’s second biggest currency trader according to Euromoney magazine, raised its year-end prediction to $1.05 from $1.
Euro Stoxx 50 declines beneath Intermediate-term support.
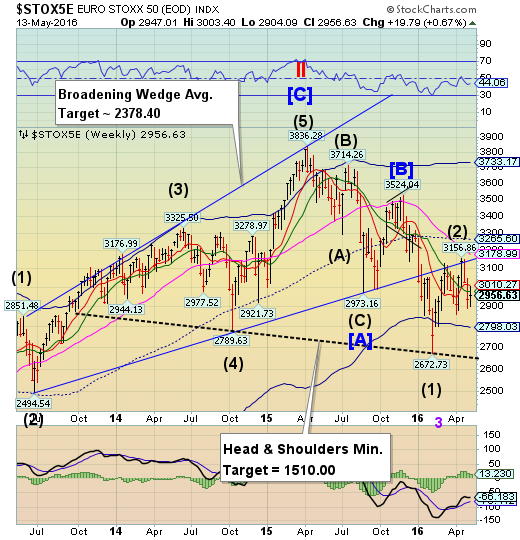
The EuroStoxx 50 Index attempted to rally, but hit a wall at Short-term resistance at 3010.27, short of the 50% retracement. It declined, closing beneath beneath Intermediate-term support at 2979.07. The index remains on a sell signal, but may challenge Short-term support once again before resuming its decline.The decline may not stop at the Cycle Bottom, but appears more likely to challenge the Head & Shoulders neckline at 2650.00. A short-term low may have formed on May 6.
(Bloomberg) European shares climbed, wiping out earlier losses, after data showing better-than-forecast U.S. data on retail sales and consumer sentiment stoked optimism about the health of the world’s biggest economy.
Retailers posted the best gains among industry groups, with Tesco (LON:TSCO) Plc and Distribuidora Intl de Aliment (LON:0Q2F) up more than 3.8 percent. Eutelsat Communications (PA:ETL) tumbled 28 percent, dragging media shares lower, after the French satellite operator cut its forecasts for this year and the next. Peer SES SA slid 8.1 percent.
The Yen remains in its uptrend.
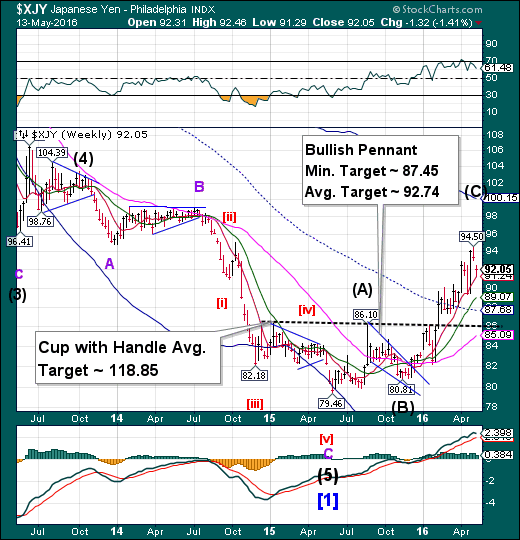
The yen corrected to its short-term support at 91.24.It may have another week of strength before the next pullback or reversal.The inverted Cup with Handle formation appears to be activated.While the Cup-with-Handle target may seem far fetched, the Cycle Top at 100.15 may be attainable as a minimum target.
(Reuters) The yen fell to a two-week low against the dollar on Thursday, pressured by speculation that the Bank of Japan could expand its monetary stimulus as soon as next month.
The Japanese currency has surged more than 9 percent against the dollar in 2016 despite Japan's series of monetary easing measures. That has fueled intervention talk from Japanese officials, resulting in a 1.7 percent drop in the value of the yen so far this week.
Talk of more action increased after prominent Japanese academic Takatoshi Ito said on Thursday Japan's central bank may expand monetary stimulus either in June or July. Ito has close ties to BOJ Governor Haruhiko Kuroda.
The Nikkei retraces 50%.
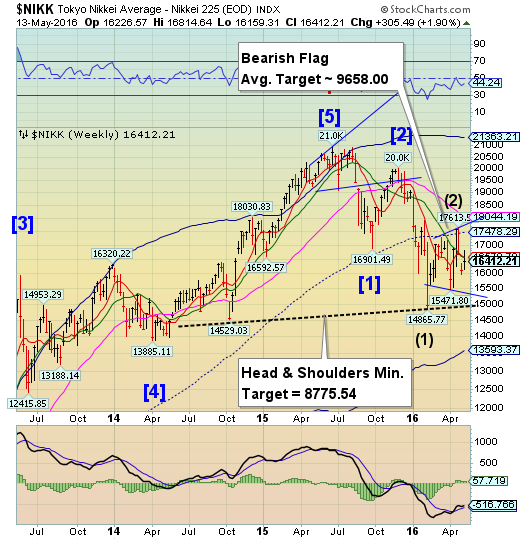
The Nikkei retraced its recent decline by 50%, closing beneath weekly Intermediate-term resistance at 16562.74.The decline may soon develop into a panic as the next support may be the Head &Shoulders neckline near 15000.00, followed by the Cycle Bottom at 13530.82.
(Reuters) Japan's three leading automakers expect a stronger yen will cost them around $14 billion in lost operating profit this year alone - just as they need to invest more in everything from cleaner fuel to driver-less cars.
After three years of supernormal profits on the back of a weaker currency, Toyota Motor Corp Ltd Ord (NYSE:TM), Nissan Motor Co., Ltd. (T:7201) and Honda Motor Company Ltd (NYSE:HMC) now face a reality check as the yen has turned around.
While the recent years' currency boon has filled automakers' coffers - Toyota alone has around $10 billion in cash - a squeeze on margins will put them under pressure to focus their investments, analysts say.
U.S. Dollar stops at Short-term resistance.
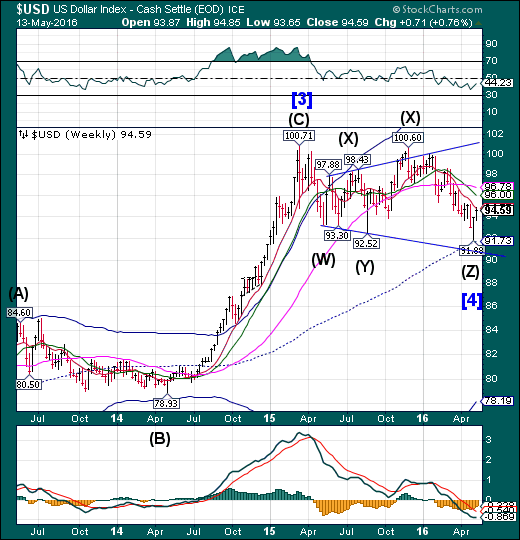
USD rallied to weekly Short-term resistance at 94.77, but may probe lower to its Broadening trendline at 90.40in the next week or so. The decline may be completed when this move reaches its target.
(Reuters) Speculators reduced bets against the dollar for the first time in four weeks, as a recent batch of improving U.S. economic data has boosted expectations the Federal Reserve could hike interest rates more than once this year.
The value of the dollar's net short position fell to $6.19 billion in the week ended May 10 from $6.46 billion the previous week, according to Reuters calculations and data from the Commodity Futures Trading Commission released on Friday.
Before this week's small decline in the dollar's net short position, sentiment on the currency had steadily declined since late December when it became evident the Fed would be cautious in raising interest rates. The U.S. central bank was worried about China's stock market and generally unimpressive U.S. economic data for the first quarter.
USB approaches a breakout.
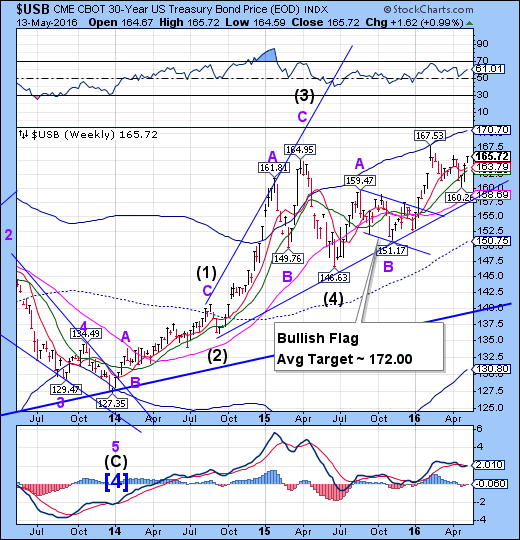
The Long Bond continued its rally nearly to its breakout point at 166.02 in a show of strength. USB appears to be due for its all-time high in the next week.Bonds have not been this overpriced (historically lowest yields) in over 300 years.
(WSJ) The U.S. government bond market rallied Friday, defying data that painted a brighter picture of the economy.
U.S. retail sales last month grew at the fastest pace in more than a year, while a monthly gauge of consumer sentiment also climbed. Yet after a brief and mild uptick, U.S. bond yields fell as their prices rose.
The yield on the benchmark 10-Year Treasury note closed at its lowest level in more than a month and approached its 2016 low set in February.
Gold pulls back, but more upside to come.
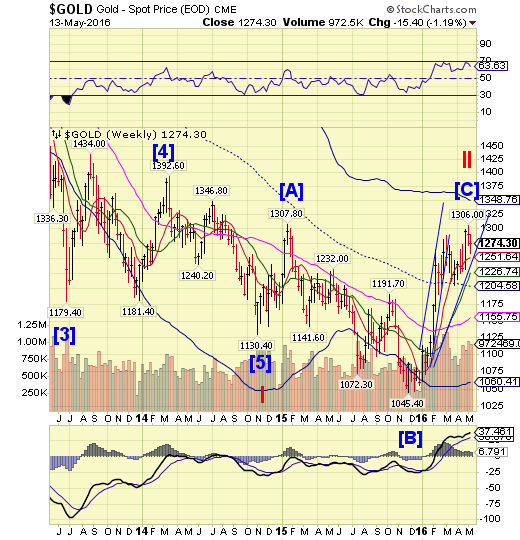
Gold remains in its uptrend. This may allow yet another probe to the weekly Cycle Top at 1348.76.This rally is extended enough that a reversal from the Cycle Top resistance or decline beneath Short-term support at 1251.64 may be the first indication of a completed rally.
(Reuters) Gold prices rose on Friday, buoyed by weak U.S. equity markets and chart-based strength, as it shrugged off a higher dollar and strong U.S.economic data suggesting a tightening outlook for the economy.
The metal briefly gave back some gains after U.S. retail sales were reported to have increased 1.3 percent last month,the most since March 2015 and more than the 0.8 percent expectedby economists.
Spot gold was up 0.8 percent at $1,273.53 an ounce at 2:46 p.m. EDT (1846 GMT). That left gold down 1.1 percent this week, the biggest weekly decline since the week ended March 25.
U.S. gold for June delivery settled up 0.1 percent at $1,272.70 an ounce. "When dollar's up and gold is up, that's a bull market for gold," said Eli Tesfaye, senior market strategist for brokerage RJO Futures in Chicago.
Crude finishing its rally.
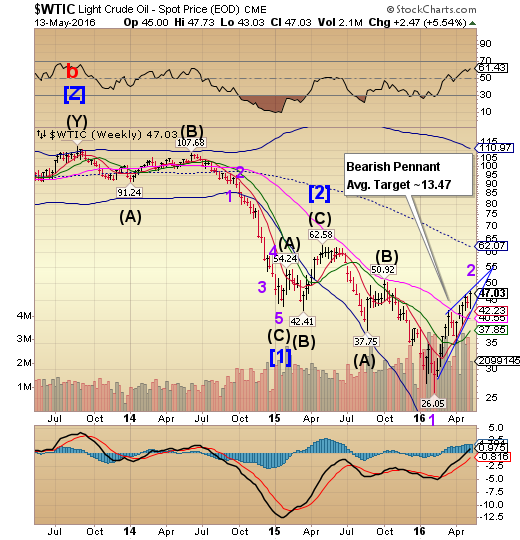
Crude appears to be in the final stage of its rally, which may only take a few more days.It may be closing in on a technical limitation for the rally and a reversal in crude prices is overdue. A decline beneath Long-term support at 42.23 may trigger a sharp decline in crude.
(ZeroHedge)For a long time, a common assumption has been that the world will eventually “run out” of oil and other non-renewable resources. Instead, we seem to be running into surpluses and low prices. What is going on that was missed by M. King Hubbert, Harold Hotelling, and by the popular understanding of supply and demand?
The underlying assumption in these models is that scarcity would appear before the final cutoff of consumption. Hubbert looked at the situation from a geologist’s point of view in the 1950s to 1980s, without an understanding of the extent to which geological availability could change with higher price and improved technology. Harold Hotelling’s work came out of the conservationist movement of 1890 to 1920, which was concerned about running out of non-renewable resources. Those using supply and demand models have equivalent concerns–too little fossil fuel supply relative to demand, especially when environmental considerations are included.
Shanghai Composite has begun its descent.
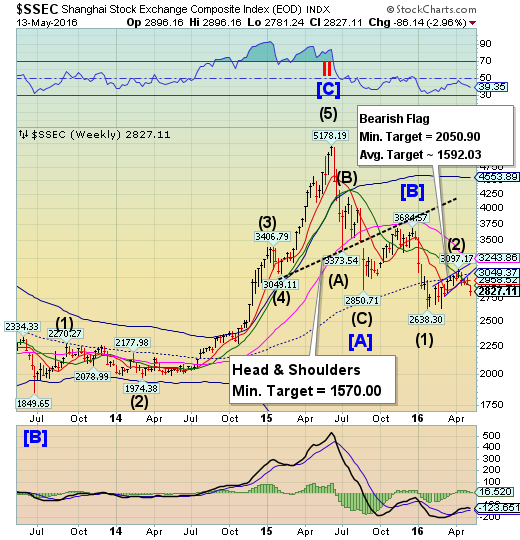
The Shanghai Index gapped beneath Intermediate-term support/resistance at 2997.49, closing the week at a loss.There appears to be as much as two weeks of weakness ahead, according to the Cycles Model.The sell signal in the Shanghai is confirmed. There is no visible support beneath the prior low at 2638.30.
(ZeroHedge) In the latest indication of contracting global growth, overnight Hong Kong reported that its Q1 GDP fell off a cliff 0.4% qoq, widely missing estimates of 0.1% growth as retail sales plummeted and the property market continued its collapse. On a y/y basis, the economy grew only 0.8% when compared to the same period last year, less than half the 1.9% y/y growth reflected in Q4.
Hong Kong's economy grew only 2.4% in 2015, half the pace of 2011, as a slowdown in mainland China and a weaker yuan curbed Chinese spending, while a volatile stock market also hit domestic consumption.
"At least over the next five to six months, we don’t see any positive growth driver that can help lift GDP growth substantially," said Raymond Yeung, an economist at Australia & New Zealand Banking Group Ltd. in Hong Kong.
The KBW Bank closes at trendline support.
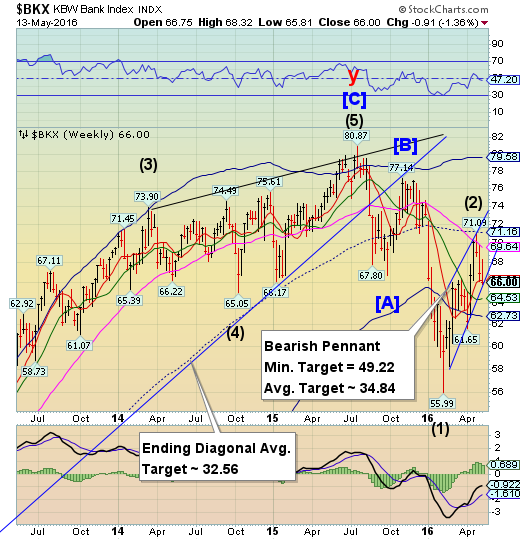
--BKX made a new weekly low, closing at trendline support at 66.00. The Pennant trendline is the key to a continued decline.Once broken, the Cycle Bottom support at 62.73 may not be capable of providing the next bounce. A significant low is due next week.
(Reuters) China's banking regulator has sent an urgent notice to banks telling them to clear bottlenecks slowing lending to private firms, sources with direct knowledge told Reuters, highlighting rising concern in Beijing about torpid private investment.
Chinese banks sharply cut new lending in April after a record first-quarter credit spree, much of which appeared to go to the state sector and may have helped inflate asset bubbles in real estate and commodities.
According to the document seen by Reuters, the China Banking Regulatory Commission (CBRC) is requiring financial institutions to conduct checks on their implementation of central government directives intended to make it easier for private firms to access bank credit.
(Business Insider) In a recent speech at the Hutchins Center at the Brookings Institution, Neel Kashkari, the new president of the Federal Reserve Bank of Minneapolis, argued that we need new strategies to tackle the problem of “too big to fail” (TBTF) financial institutions.
On Monday, I’ll be on a panel at the Minneapolis Fed on the issue. This post previews my comments. In short, it seems to me that a lot of progress has been made (and more is in train) toward reducing the risks that large, complex financial institutions pose for the financial system and the economy. To say that “nothing has been done” is simply not correct.
That said, because it’s really important to get this right, thoughtful debate on the issue is necessary and welcome.
(ZeroHedge) Ever since merchants changed out payment terminals last October in order to comply with new rules and accept chip cards, merchants are seeing expenses relating to debit transaction fees increasing, in some cases as much as 20%. The reason stems from transaction terminals being set up to steer transactions in such a way that will generate the most revenue for the data processing company.
As the Chicago Tribune explains
In the past year, many merchants changed their payment terminals so consumers could use the newfangled cards. The problem is that about two-thirds of the new readers at smaller retailers aren't set up right, according to Richard Crone, chief executive officer of the consulting firm. Their software tends to favor debit-payment networks from Visa Inc (NYSE:V) and Mastercard Incorporated (NYSE:MA) over other systems, which can be cheaper for merchants on certain transactions, he said.
