- Dovish Bullard lowers rate cut expectations
- Iran escalates military tensions
- 144 S&P 500 components, 10 of 30 Dow members slated to release earnings
While the trajectory for U.S. stocks is still up, signs are mounting for a correction in the short term. We expect volatility to increase as the pace of earnings season picks up, tensions with Iran grow and the Federal Reserve prepares to take a key decision on interest rates.
All four major U.S. indices declined on Friday, ending lower for the week.
The S&P 500 fell following mixed comments from members of the Fed, with some appearing to favor a half-percentage point rate cut and others – including James Bullard – saying they backed a quarter-point June rate cut. Bullard’s comments sent yields and the dollar higher as he is considered one of the most dovish members of the Fed and if he’s supporting a 25 basis points cut, the odds of a larger reduction are low.
Geopolitics also played a role in risk off, after Iran’s Revolutionary Guard captured a British oil tanker in the Strait of Hormuz in retaliation for the U.K. seizing an Iranian tanker near Gibraltar. The moves heightened what are already increased tensions in the region.
Technically, Friday’s drop reinforced our view that the S&P 500 is ripe for at least a correction. Friday’s price action extended the penetration after the bearish evening star that developed the previous Friday through Tuesday, which brought the level below its short-term uptrend line. Also, a Friday close has more technical significance. The MACD’s short to long MA deepened its inversion, and the RSI completed the anticipated triple top. The uptrend will reverse when price action forms at least two descending peaks and troughs.
Morgan Stanley (NYSE:MS) is also bearish. They’re forecasting an up to 10% correction due to overestimated earnings, the S&P 500 Index’s 3,000 resistance and overpricing the Fed’s much anticipated rate cut.
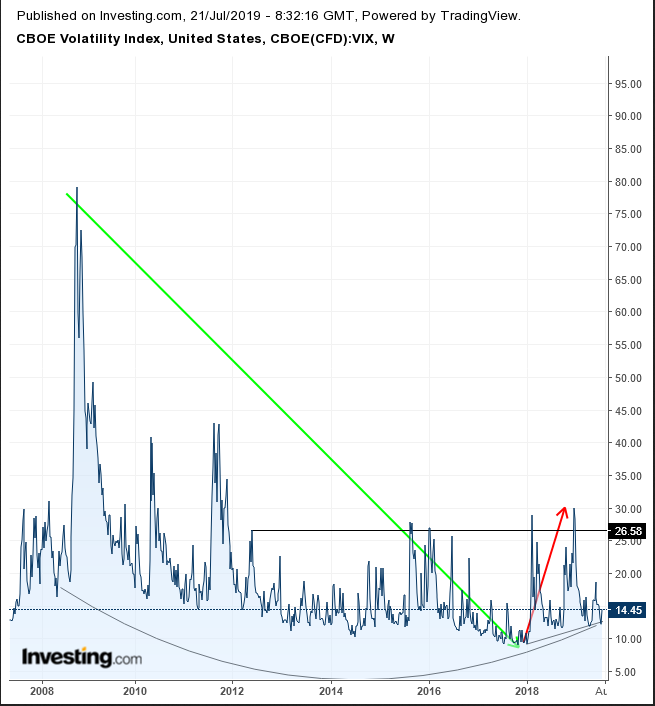
The VIX volatility index is bottoming, increasing the probability for a spike. Note the two recent spikes, February and December 2018 matched SPX lows within a broadening pattern.

This week, 144 of the S&P 500 components and 10 of the 30 members of the Dow Jones Industrial Average are due to report earnings which should boost volatility. Last week’s earnings reports, with more than a third of companies blaming trade for weakening results, has investors bracing for more pain.
The S&P 500 Index lost 0.62% Friday, with defensive Real Estate (-1.71%) and Utilities (-1.42%) suffering the worst. However, Communication Services (1.29%) also fell out of favor. Although Technology (0.55%) fell as well, remaining trade-related sectors were the only sectors in the green. Industrials (+0.53%) outperformed, followed by Energy (+0.50%) and Materials (+0.26%).
The popular gauge dropped 1.23% for the week, with Communication Services (-3.22%) underperforming, followed by Energy - tracking oil’s five straight day loss on global demand concerns – and Real Estate (-2.18%).

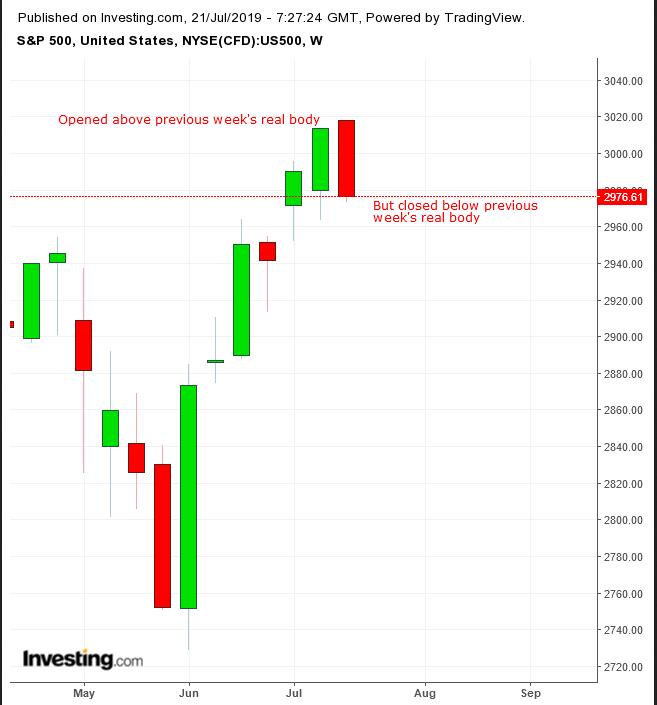
The weekly chart reveals a weekly bearish engulfing pattern. The bearish pattern’s development after hitting a record makes the signal more pessimistic.

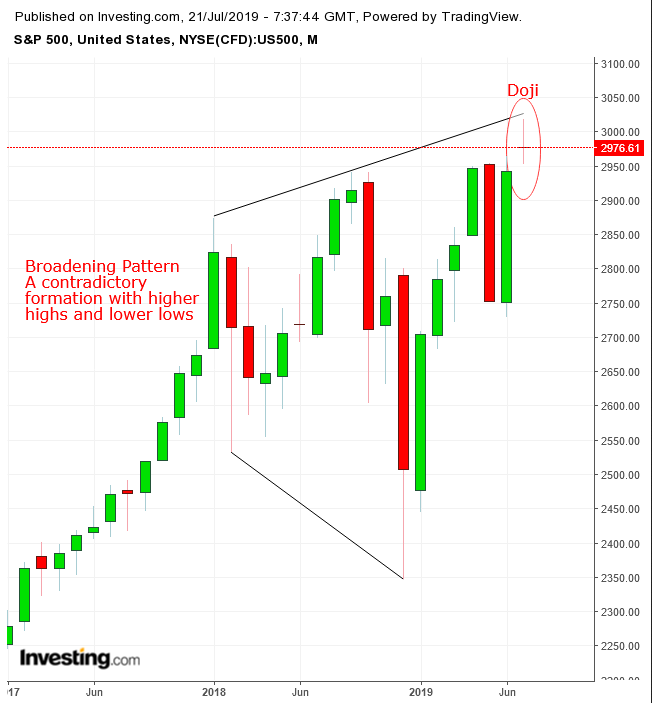
On the monthly chart, the candle is forming a doji after opening higher, opening the door for a monthly doji-evening star, whose negative impact would be proportionately more potent than that of the daily chart, with the potential for a much deeper correction.
The Week Ahead
All times listed are EDT
Tuesday
10:00: U.S. – U.S. Existing Home Sales expected to edge higher to 5.35M from 5.34M
Wednesday
3:30: Germany – German Manufacturing PMI likely to creep up to 45.1 from 45.0, still well below the 50.00 expansion territory.
10:00: U.S. – U.S. New Home Sales seen to be 659K from 626K
10:30: U.S. – Crude Oil Inventories

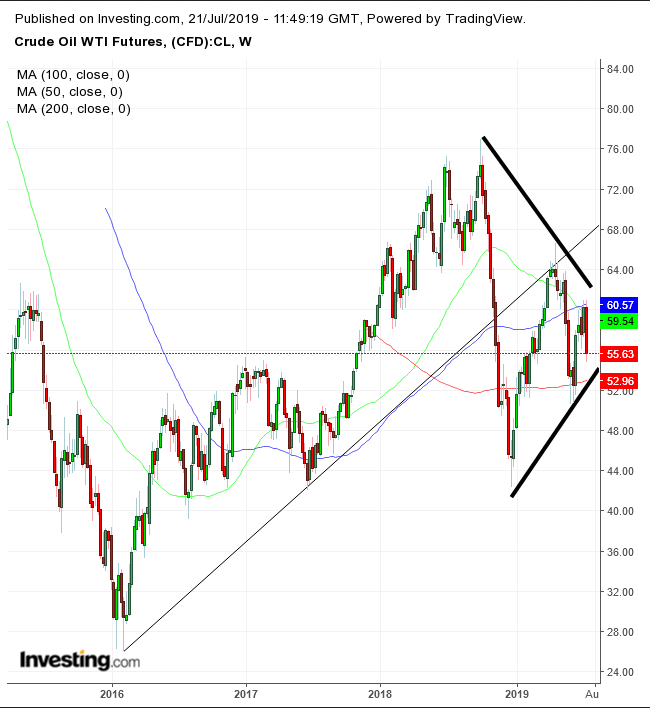
The symmetrical triangle that began in October projects the lack of clarity about the trajectory for oil. It demonstrates that both buyers and sellers are committed to their outlooks. The pattern is an interruption within the uptrend. The price congests as it approaches the apex. The next decisive breakout will signal the direction of the trend here on out.
Thursday
4:00: Germany – German ifo Business climate Index forecast to edge down to 97.1 from 97.4
7:45: U.K. – ECB Interest Rate Decision expected to remain at 0.00%
8:30: U.S. – Core Durable Goods seen to have declined to 0.2% from 0.4%
8:30: U.K – ECB Press Conference
Friday
6:30: Russia – Interest Rate Decision likely keep rates at 7.5%
8:30: U.S. – GDP forecast to plunge to 1.8% from 3.1%
